目次
matplotlib
前回、Pythonのmatplotlibでグラフの中に拡大図のような小さなグラフを表示する方法:axes編を紹介しました。
あわせて読みたい

【matplotlib】グラフ作成テクニック:拡大図を挿入する方法(plt.axes編)[Python]
matplotlib 前回、PythonのPandasでデータをもつデータフレームを作成する方法を紹介しました。 今回はmatplotlibで「plt.axes()」という関数を使ったグラフの中に拡大…
ただ「plt.axes()」を使うとグラフの中に小さなグラフを表示はできるものの、拡大図の場合、どこの部分を拡大したグラフなのかは分かりませんでした。
今回はどこを拡大したか分かるような関数「inset_axes()」を紹介します。
使うグラフは前回同様こちらのグラフです。
import matplotlib.pyplot as plt
import random

x = range(10000)
y = [xval + random.uniform(-1, 1) for xval in x]

fig = plt.figure()
plt.clf()

plt.plot(x, y)

plt.show()

実行結果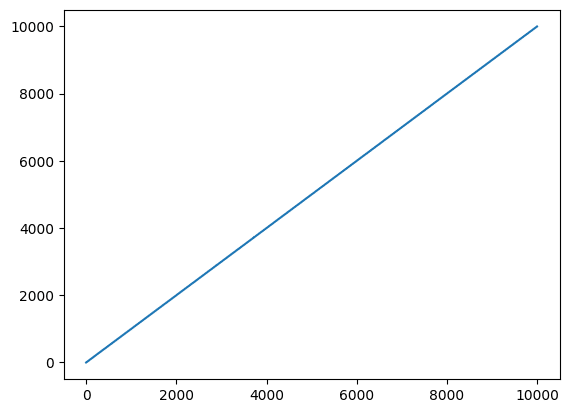
拡大すると実はガタガタというグラフです。
import matplotlib.pyplot as plt
import random

x = range(10000)
y = [xval + random.uniform(-1, 1) for xval in x]

fig = plt.figure()
plt.clf()

plt.plot(x, y)

plt.xlim(0, 10)
plt.ylim(0, 10)

plt.show()

実行結果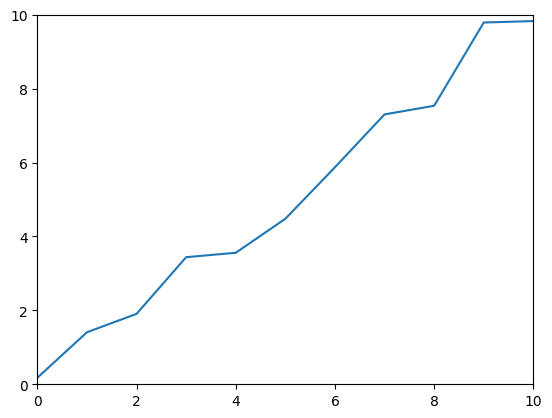
それでは始めていきましょう。
グラフの中にどこを拡大したか分かる形で小さなグラフを表示する方法
グラフの中にどこを拡大したか分かる形で小さなグラフを表示するには「変数 = plt.gca().inset_axes([左下のX軸方向の位置, 左下のY軸方向の位置, 幅, 高さ])」を用います。
数値は元のグラフに対する比率で表します。
プログラム中に「plt.gca().indicate_inset_zoom(変数)」を追加することで、グラフ上のどの部分を拡大したか分かるように線が表示されます。
import matplotlib.pyplot as plt
import random

x = range(10000)
y = [xval + random.uniform(-1, 1) for xval in x]

fig = plt.figure()
plt.clf()

plt.plot(x, y)

plt.xlabel("xlabel_out")
plt.ylabel("ylabel_out")

inset = plt.gca().inset_axes([0.15, 0.6, 0.3, 0.3])
inset.plot(x, y)

inset.set_xlabel("xlabel_in1")
inset.set_ylabel("ylabel_in1")

inset.set_xlim(0, 10)
inset.set_ylim(0, 10)

plt.gca().indicate_inset_zoom(inset)

plt.show()

実行結果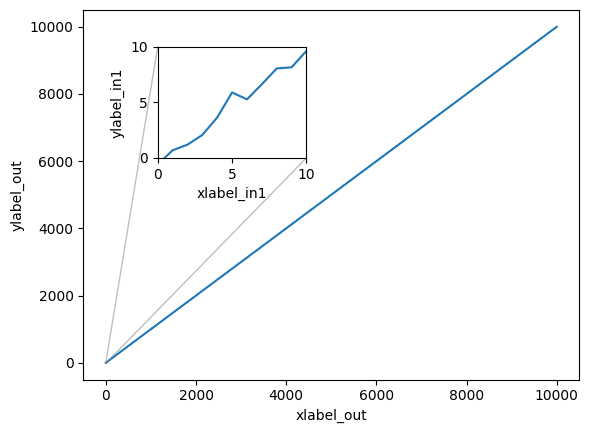
基本的には前回の「axes()」と同じなので、細かい解説は省きます。
「subplots()」を使えば「ax1」、「ax2」といった書き方も可能です。
import matplotlib.pyplot as plt
import random

x = range(10000)
y = [xval + random.uniform(-1, 1) for xval in x]

fig = plt.figure()
plt.clf()

ax1 = fig.subplots()

ax1.plot(x, y)

ax1.set_xlabel("xlabel_out")
ax1.set_ylabel("ylabel_out")

ax2 = ax1.inset_axes([0.15, 0.6, 0.3, 0.3])
ax2.plot(x, y)

ax2.set_xlabel("xlabel_in1")
ax2.set_ylabel("ylabel_in1")

ax2.set_xlim(0, 10)
ax2.set_ylim(0, 10)

ax1.indicate_inset_zoom(ax2)

plt.show()

実行結果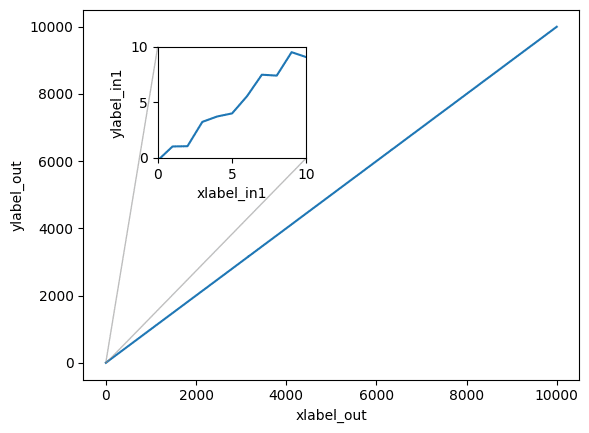
もちろん複数の拡大図を表示することも可能です。
import matplotlib.pyplot as plt
import random

x = range(10000)
y = [xval + random.uniform(-1, 1) for xval in x]

fig = plt.figure()
plt.clf()

ax1 = fig.subplots()

ax1.plot(x, y)

ax1.set_xlabel("xlabel_out")
ax1.set_ylabel("ylabel_out")

ax2 = ax1.inset_axes([0.15, 0.6, 0.3, 0.3])
ax2.plot(x, y)

ax2.set_xlabel("xlabel_in1")
ax2.set_ylabel("ylabel_in1")

ax2.set_xlim(0, 10)
ax2.set_ylim(0, 10)

ax1.indicate_inset_zoom(ax2)

ax3 = ax1.inset_axes([0.6, 0.15, 0.3, 0.3])

ax3.plot(x, y)

ax3.set_xlabel("xlabel_in2")
ax3.set_ylabel("ylabel_in2")

ax3.set_xlim(990, 1000)
ax3.set_ylim(990, 1000)

ax1.indicate_inset_zoom(ax3)

plt.show()

実行結果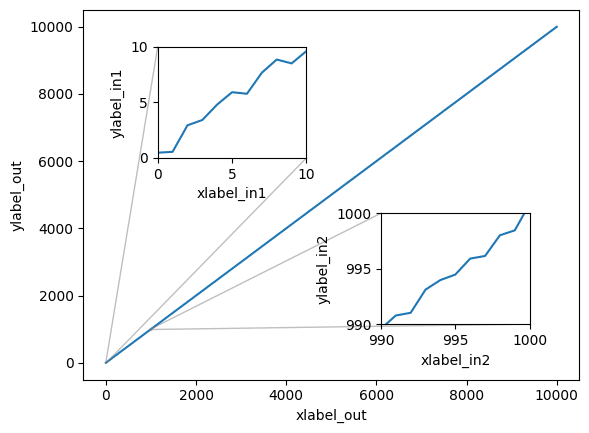
次回は再帰処理を使ってランダムかつ0が出ないプログラムを作成する方法を紹介します。
あわせて読みたい

【Python基礎】再帰処理を使って0を含まないランダムな数値のリストを作成する方法
再帰処理 前回、Pythonのmatplotlibでグラフの中に拡大図のような小さなグラフを表示する方法:inset_axes編を紹介しました。 今回は再帰処理を使って0を含まないランダ…
ではでは今回はこんな感じで。

コメント