matplotlib
前回、Pythonのmatplotlibで画像サイズの設定方法を解説しました。
今回はmaplotlibでの余白の設定方法を解説します。
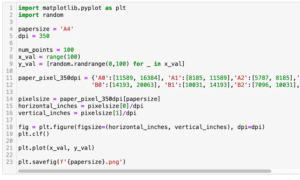
まずはこんな感じで基本となるプログラムを作成してみました。
import matplotlib.pyplot as plt
import random

num_points = 100
x_val = range(100)
y_val = [random.randrange(0,100) for _ in x_val]

fig = plt.figure(facecolor="lightgrey")
plt.clf()

plt.plot(x_val, y_val)

plt.savefig('test1.png')
ランダムで100個のポイントをもつデータを作成し、グラフ化しています。
今回は余白の話ですので、余白が分かりやすいように「plt.figure(facecolor=”lightgrey”)」として背景を灰色にしています。
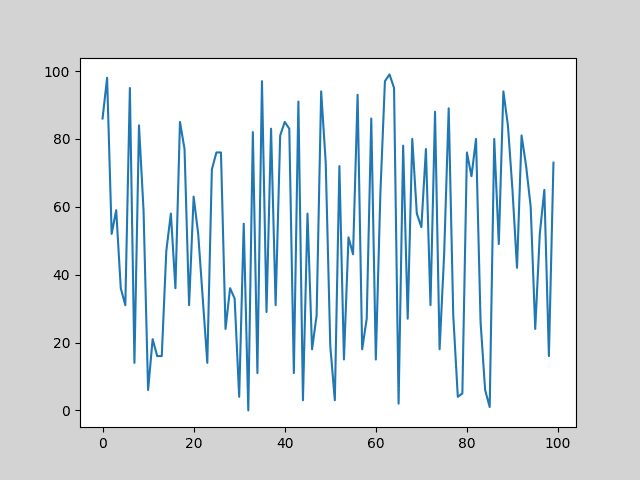
出力されたグラフはこちらです。
余白の設定:plt.subplots_adjust
余白の設定をするには「plt.subplots_adjust(left=左の余白, right=右の余白, bottom=下の余白, top=上の余白)」を使用します。
またそれぞれの余白は左下を0、右上を1とした比率で記述します。
つまり上下左右全て外側から5%の位置までを余白としたい場合は、左:0.05、右:0.995、下:0.05、上:0.995とします。
import matplotlib.pyplot as plt
import random

num_points = 100
x_val = range(100)
y_val = [random.randrange(0,100) for _ in x_val]

fig = plt.figure(facecolor="lightgrey")
plt.clf()

plt.plot(x_val, y_val)

plt.subplots_adjust(left=0.05, right=0.995, bottom=0.05, top=0.995)

plt.savefig('test2.png')

実行結果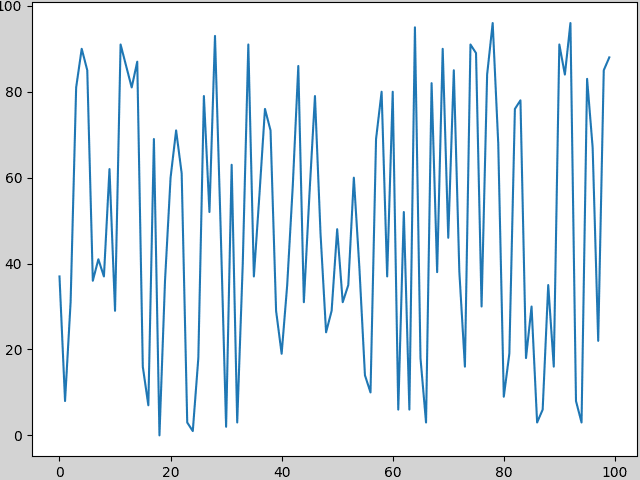
ちなみにデフォルトの余白は左:0.125、,右:0.9、下:0.1、上:0.9とのことです。
それでは余白を多めに取るとどうなるかみてみましょう。
左:0.25、右:0.75、下:0.25、上:0.75にしてみました。
import matplotlib.pyplot as plt
import random

num_points = 100
x_val = range(100)
y_val = [random.randrange(0,100) for _ in x_val]

fig = plt.figure(facecolor="lightgrey")
plt.clf()

plt.plot(x_val, y_val)

plt.subplots_adjust(left=0.25, right=0.75, bottom=0.25, top=0.75)

plt.savefig('test3.png')

実行結果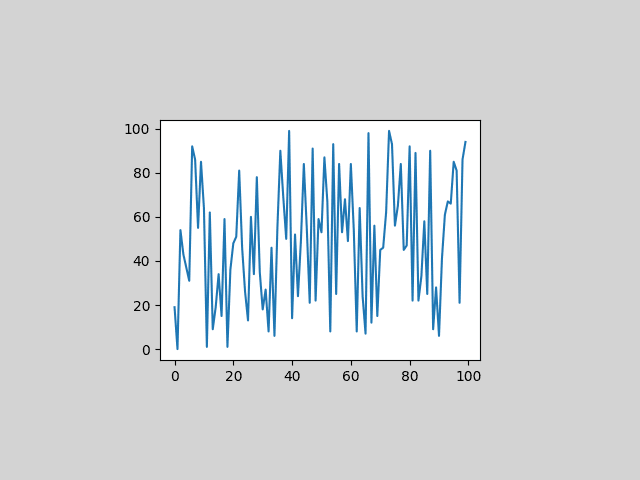
かなり違いがわかってもらえると思います。
savefigでグラフを保存した際の余白の設定
次にsavefigでグラフを保存した時の余白の設定方法を紹介します。
上記の方法でもグラフの画像を保存すれば設定した余白で保存されます。
ただ保存する画像だけ設定した余白にしたいときはsavefigで余白を設定する方が楽かもしれません。
つまりこれ以降紹介する方法ではJupyter notebook上の表示のされ方は変化しないことに注意してください。
その場合、まず「plt.savefig()」に余白を削除する「bbox_inches=”tight”」のオプションを追加します。
import matplotlib.pyplot as plt
import random

num_points = 100
x_val = range(100)
y_val = [random.randrange(0,100) for _ in x_val]

fig = plt.figure(facecolor="lightgrey")
plt.clf()

plt.plot(x_val, y_val)

plt.savefig('test4.png', bbox_inches="tight")

実行結果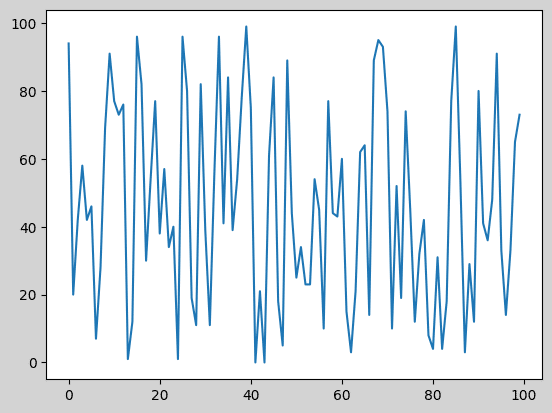
そして次に余白を指定する「pad_inches=余白サイズ」をオプションに追加します。
import matplotlib.pyplot as plt
import random

num_points = 100
x_val = range(100)
y_val = [random.randrange(0,100) for _ in x_val]

fig = plt.figure(facecolor="lightgrey")
plt.clf()

plt.plot(x_val, y_val)

plt.savefig('test5.png', bbox_inches="tight", pad_inches=5)

実行結果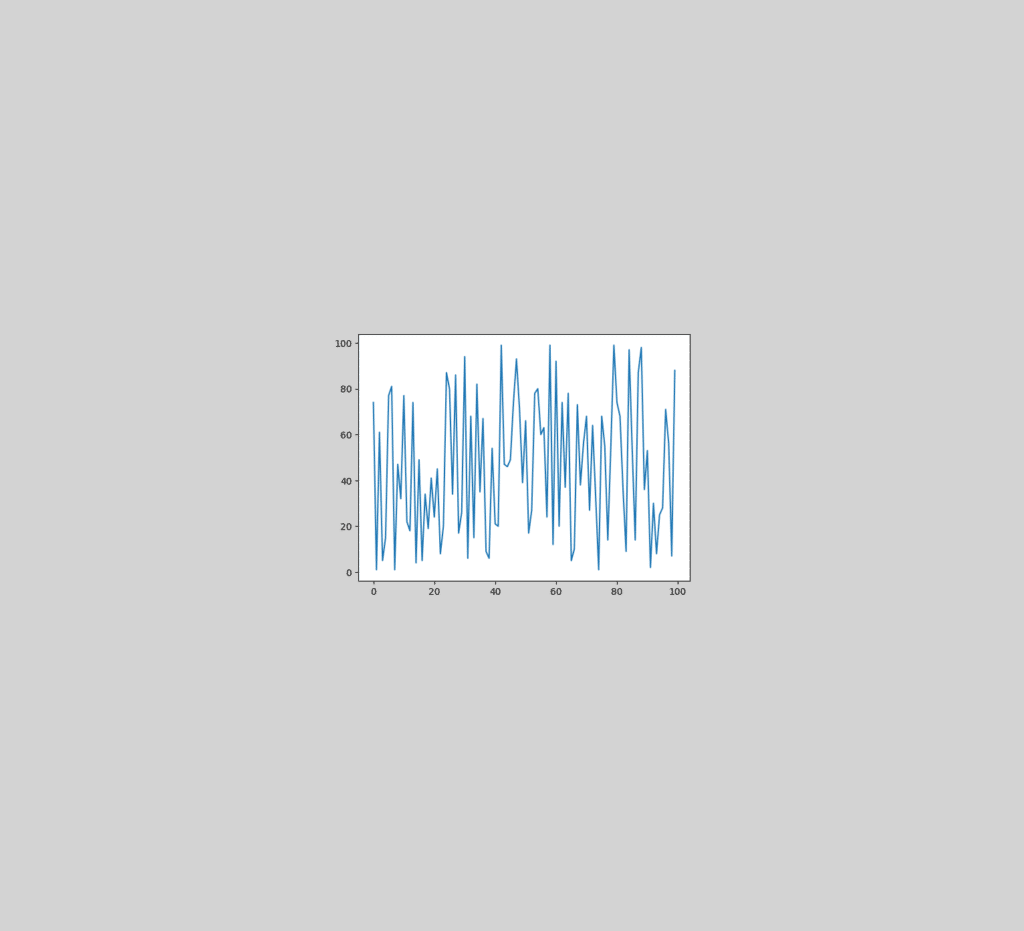
ちなみに「bbox_inches=”tight”」を入れないと、「pad_inches=余白サイズ」で余白を調節しようとしてもできないことに注意です。
import matplotlib.pyplot as plt
import random

num_points = 100
x_val = range(100)
y_val = [random.randrange(0,100) for _ in x_val]

fig = plt.figure(facecolor="lightgrey")
plt.clf()

plt.plot(x_val, y_val)

plt.savefig('test6.png', pad_inches=5)

実行結果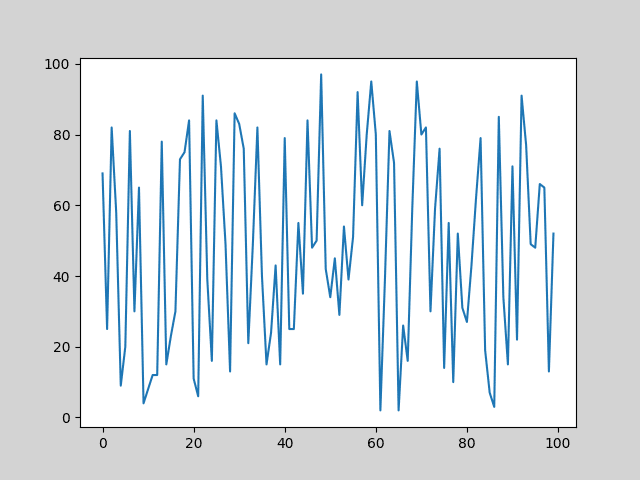
グラフによって良い見栄えになる余白が変わってくるので、ぜひ色々と試してみてください。
次回はJupyter Notebook上でプログラムの実行結果をクリアする方法を解説します。
ではでは今回はこんな感じで。
コメント