import numpy as np
import matplotlib.pyplot as plt
import random
x = range(100)
random.seed(100)
y = [np.sin(np.radians(x_val)*10) + random.uniform(-0.5, 0.5) for x_val in x]
fig = plt.figure()
plt.clf()
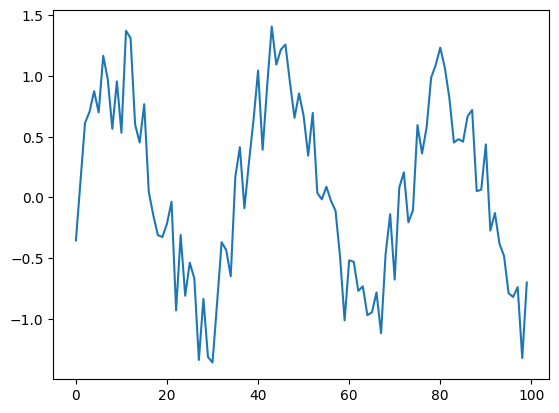
plt.plot(x, y)
plt.show()
実行結果
import numpy as np
import matplotlib.pyplot as plt
import random
from scipy.signal import argrelmax
x = range(100)
random.seed(100)
y = [np.sin(np.radians(x_val)*10) + random.uniform(-0.5, 0.5) for x_val in x]
relmax = argrelmax(np.array(y))
x_relmax = [x[ind] for ind in relmax[0]]
y_relmax = [y[ind] for ind in relmax[0]]
fig = plt.figure()
plt.clf()
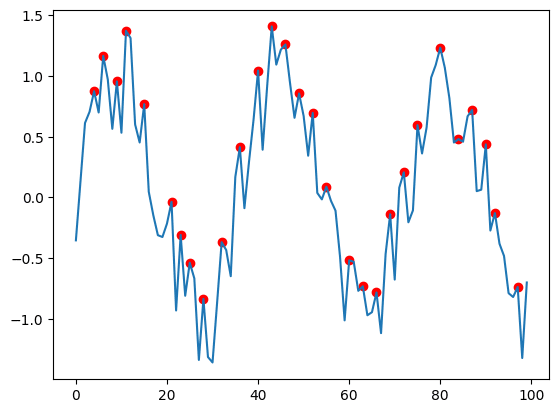
plt.plot(x, y)
plt.scatter(x_relmax, y_relmax, color="Red")
plt.show()
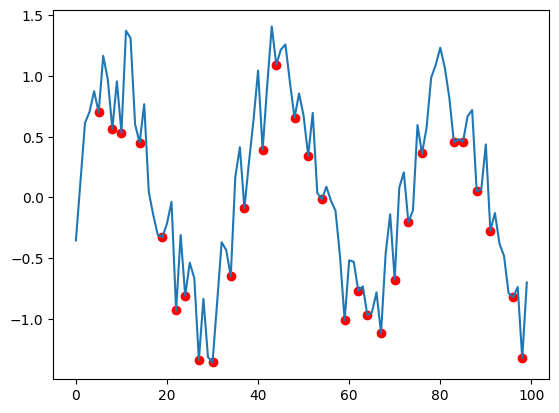
実行結果
次に極小値を取得してみます。
import numpy as np
import matplotlib.pyplot as plt
import random
from scipy.signal import argrelmin

x = range(100)

random.seed(100)
y = [np.sin(np.radians(x_val)*10) + random.uniform(-0.5, 0.5) for x_val in x]

relmin = argrelmin(np.array(y))

x_relmin = [x[ind] for ind in relmin[0]]
y_relmin = [y[ind] for ind in relmin[0]]

fig = plt.figure()
plt.clf()

plt.plot(x, y)
plt.scatter(x_relmin, y_relmin, color="Red")

plt.show()

実行結果
ちなみにargrelmax、argrelminに通常のリストを渡すとエラーとなります。
import numpy as np
import matplotlib.pyplot as plt
import random
from scipy.signal import argrelmax

x = range(100)

random.seed(100)
y = [np.sin(np.radians(x_val)*10) + random.uniform(-0.5, 0.5) for x_val in x]

relmax = argrelmax(y)

x_relmax = [x[ind] for ind in relmax[0]]
y_relmax = [y[ind] for ind in relmax[0]]

fig = plt.figure()
plt.clf()

plt.plot(x, y)
plt.scatter(x_relmax, y_relmax, color="Red")

plt.show()

実行結果
---------------------------------------------------------------------------
AttributeError                            Traceback (most recent call last)
Cell In[1], line 11
      8 random.seed(100)
      9 y = [np.sin(np.radians(x_val)*10) + random.uniform(-0.5, 0.5) for x_val in x]
---> 11 relmax = argrelmax(y)
     13 x_relmax = [x[ind] for ind in relmax[0]]
     14 y_relmax = [y[ind] for ind in relmax[0]]

(中略)

AttributeError: 'list' object has no attribute 'shape'
コメント