lmfit
前回、再帰処理を使って積立の複利計算をする方法を紹介しました。
今回はlmfitでフィッティング精度を上げられるかもしれない4つの方法を紹介します。
ちなみにlmfitに関してはこちらの記事で紹介していますので、よかったらどうぞ。
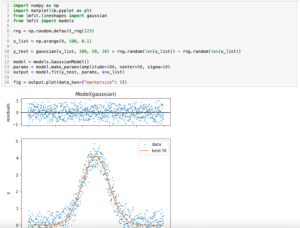
まずは今回フィッティングさせるデータを出力するプログラムをこんな感じで作成してみました。
import numpy as np
import matplotlib.pyplot as plt
from lmfit.lineshapes import gaussian
from lmfit import models

x_list = np.arange(0, 100)

rng = np.random.default_rng()

y_gaussian = gaussian(x_list, 50, 50, 10) + rng.random(len(x_list)) - rng.random(len(x_list))

fig = plt.figure()
plt.clf()

plt.plot(x_list, y_gaussian, label="test")

plt.legend()
plt.show()

実行結果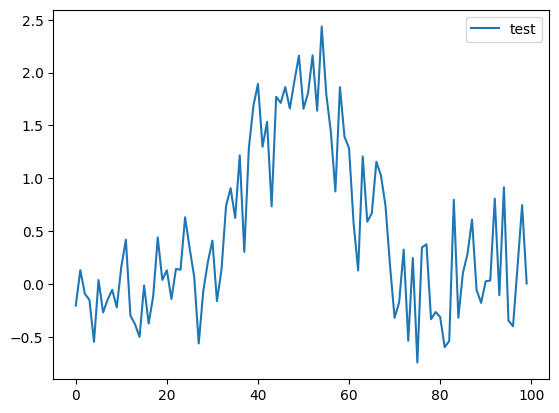
このグラフに対し、lmfitのGaussianモデルでフィッティングしてみます。
import numpy as np
import matplotlib.pyplot as plt
from lmfit.lineshapes import gaussian
from lmfit import models

x_list = np.arange(0, 100)

rng = np.random.default_rng()

y_gaussian = gaussian(x_list, 50, 50, 10) + rng.random(len(x_list)) - rng.random(len(x_list))

model = models.GaussianModel()

output = model.fit(y_gaussian, x=x_list)

fig = plt.figure()
plt.clf()

plt.plot(x_list, y_gaussian, label="test")
plt.plot(x_list, output.best_fit, label="best_fit")

plt.legend()
plt.show()

print(output.fit_report())

実行結果
[[Model]]
    Model(gaussian)
[[Fit Statistics]]
    # fitting method   = leastsq
    # function evals   = 59
    # data points      = 100
    # variables        = 3
    chi-square         = 110.519015
    reduced chi-square = 1.13937129
    Akaike info crit   = 16.0017401
    Bayesian info crit = 23.8172507
    R-squared          = -0.43890738
[[Variables]]
    amplitude:  2.43989630 +/- 3.69969122 (151.63%) (init = 1)
    center:     3.59104267 +/- 3.66274767 (102.00%) (init = 0)
    sigma:      2.12250943 +/- 3.83154805 (180.52%) (init = 1)
    fwhm:       4.99812758 +/- 9.02260600 (180.52%) == '2.3548200*sigma'
    height:     0.45859766 +/- 0.68342331 (149.02%) == '0.3989423*amplitude/max(1e-15, sigma)'
[[Correlations]] (unreported correlations are < 0.100)
    C(amplitude, sigma) = +0.6096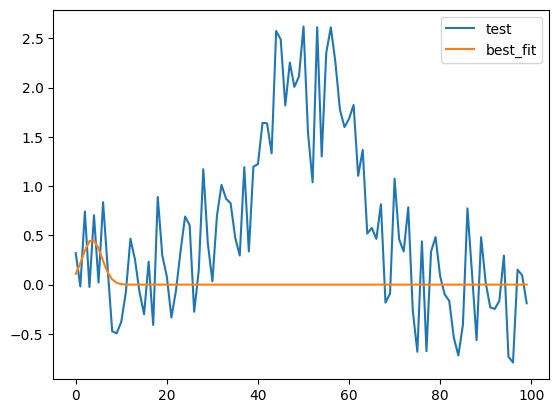
うまくフィッティングできていません。
今回はこうなった時になんとかしてフィッティング精度を上げる方法を紹介していきます。
今回のグラフに対して、うまく行ったり行かなかったりですが、それはケースバイケースになりますので、試してみたらいいレーパートリーの中に入れておくといいかと思います。
それでは始めていきましょう。
方法1:model.guess
まずはlmfitにおおまかにフィッティングパラメータを予測させ、それを用いてフィッティングさせる方法があります。
その場合は「model.guess(yの値のリスト, Xの値のリスト)」を用います。
import numpy as np
import matplotlib.pyplot as plt
from lmfit.lineshapes import gaussian
from lmfit import models

x_list = np.arange(0, 100)

rng = np.random.default_rng()

y_gaussian = gaussian(x_list, 50, 50, 10) + rng.random(len(x_list)) - rng.random(len(x_list))

model = models.GaussianModel()

params = model.guess(y_gaussian, x_list)

print(params)

実行結果
Parameters([('amplitude', <Parameter 'amplitude', value=224.23687580517395,
bounds=[-inf:inf]>), ('center', <Parameter 'center', value=48.096774193548384,
bounds=[-inf:inf]>), ('sigma', <Parameter 'sigma', value=23.0, bounds=[0.0:inf]>),
('fwhm', <Parameter 'fwhm', value=54.16086, bounds=[-inf:inf], expr='2.3548200*sigma'>),
('height', <Parameter 'height', value=3.8894597816752374, bounds=[-inf:inf],
expr='0.3989423*amplitude/max(1e-15, sigma)'>)])
これでおおまかなパラメータ予測ができました。
次にこのパラメータ(今回は変数params)を使って、フィッティングさせます。
その場合は「model.fit(Yの値のリスト, params=パラメータ値, x=Xの値のリスト)」とします。
import numpy as np
import matplotlib.pyplot as plt
from lmfit.lineshapes import gaussian
from lmfit import models

x_list = np.arange(0, 100)

rng = np.random.default_rng()

y_gaussian = gaussian(x_list, 50, 50, 10) + rng.random(len(x_list)) - rng.random(len(x_list))

model = models.GaussianModel()

params = model.guess(y_gaussian, x_list)

output = model.fit(y_gaussian, params=params, x=x_list)

fig = plt.figure()
plt.clf()

plt.plot(x_list, y_gaussian, label="test")
plt.plot(x_list, output.best_fit, label="best_fit")

plt.legend()
plt.show()

print(output.fit_report())

実行結果
[[Model]]
    Model(gaussian)
[[Fit Statistics]]
    # fitting method   = leastsq
    # function evals   = 33
    # data points      = 100
    # variables        = 3
    chi-square         = 18.1943627
    reduced chi-square = 0.18757075
    Akaike info crit   = -164.405838
    Bayesian info crit = -156.590328
    R-squared          = 0.73955648
[[Variables]]
    amplitude:  55.9233053 +/- 3.22057230 (5.76%) (init = 215.5318)
    center:     50.8111212 +/- 0.69153344 (1.36%) (init = 52.41379)
    sigma:      10.3993721 +/- 0.69154100 (6.65%) (init = 20)
    fwhm:       24.4886491 +/- 1.62845456 (6.65%) == '2.3548200*sigma'
    height:     2.14533840 +/- 0.12354787 (5.76%) == '0.3989423*amplitude/max(1e-15, sigma)'
[[Correlations]] (unreported correlations are < 0.100)
    C(amplitude, sigma) = +0.5774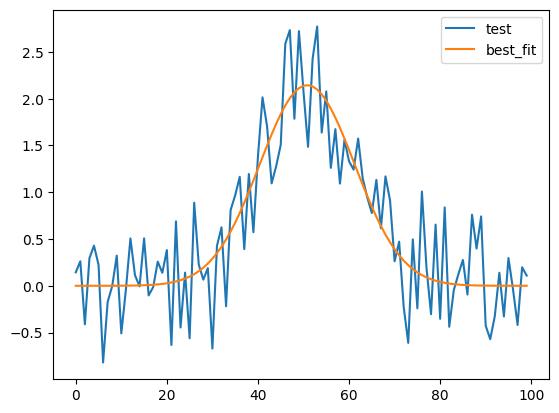
なかなか強力そうですが、実は弱点があり、複合モデルに対しては「model.guess」は使えません。
import numpy as np
import matplotlib.pyplot as plt
from lmfit.lineshapes import gaussian
from lmfit import models

x_list = np.arange(0, 100)

rng = np.random.default_rng()

gaussian1 = gaussian(x_list, 35, 35, 5) + rng.random(len(x_list)) - rng.random(len(x_list))
gaussian2 = gaussian(x_list, 55, 70, 7) + rng.random(len(x_list)) - rng.random(len(x_list))

y_gaussian = gaussian1 + gaussian2

model1 = models.GaussianModel(prefix="gauss1_")
model2 = models.GaussianModel(prefix="gauss2_")

model = model1 + model2

params = model.guess(y_gaussian, x=x_list)

実行結果
---------------------------------------------------------------------------
NotImplementedError                       Traceback (most recent call last)
Cell In[64], line 18
     14 model2 = models.GaussianModel(prefix="gauss2_")
     16 model = model1 + model2
---> 18 params = model.guess(y_gaussian, x=x_list)

File /Library/Frameworks/Python.framework/Versions/3.10/lib/python3.10/site-packages/lmfit/model.py:785, in Model.guess(self, data, x, **kws)
    783 cname = self.__class__.__name__
    784 msg = f'guess() not implemented for {cname}'
--> 785 raise NotImplementedError(msg)

NotImplementedError: guess() not implemented for CompositeModel
方法2:methodの変更
次にフィッティングさせる方法(method)の変更を紹介します。
フィッティングの方法を変更する場合は「model.fit(Yの値のリスト, x=Xの値のリスト, method=”メソッド”)」とします。
methodにはlmfitのminimize関数のメソッドが使用できます。
import numpy as np
import matplotlib.pyplot as plt
from lmfit.lineshapes import gaussian
from lmfit import models

x_list = np.arange(0, 100)

rng = np.random.default_rng()

y_gaussian = gaussian(x_list, 50, 50, 10) + rng.random(len(x_list)) - rng.random(len(x_list))

model = models.GaussianModel()

output = model.fit(y_gaussian, x=x_list, method="least_squares")

fig = plt.figure()
plt.clf()

plt.plot(x_list, y_gaussian, label="test")
plt.plot(x_list, output.best_fit, label="best_fit")

plt.legend()
plt.show()

print(output.fit_report())

実行結果
[[Model]]
    Model(gaussian)
[[Fit Statistics]]
    # fitting method   = least_squares
    # function evals   = 71
    # data points      = 100
    # variables        = 3
    chi-square         = 83.6274322
    reduced chi-square = 0.86213848
    Akaike info crit   = -11.8798583
    Bayesian info crit = -4.06434777
    R-squared          = -0.34008871
[[Variables]]
    amplitude:  1.71284851 +/- 2.35250603 (137.34%) (init = 1)
    center:     3.27591804 +/- 1.91400170 (58.43%) (init = 0)
    sigma:      1.20697488 +/- 1.91449196 (158.62%) (init = 1)
    fwhm:       2.84220855 +/- 4.50828398 (158.62%) == '2.3548200*sigma'
    height:     0.56614909 +/- 0.77755758 (137.34%) == '0.3989423*amplitude/max(1e-15, sigma)'
[[Correlations]] (unreported correlations are < 0.100)
    C(amplitude, sigma) = +0.5775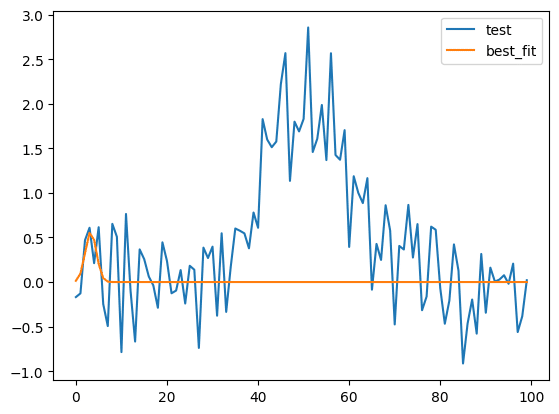
方法3:weightの設定
次にweightの設定を紹介します。
weight、つまりそれぞれの値に重みをつけてフィッティングします。
ここでは元のデータを少し変え、0から10までと90から99までの値を10に固定します。
そしてそのグラフの0から29までの重みを「0」、30から70までの重みを「100」、71から99までの重みを0にしてフィッティングしてみます。
import numpy as np
import matplotlib.pyplot as plt
from lmfit.lineshapes import gaussian
from lmfit import models

x_list = np.arange(0, 100)

rng = np.random.default_rng()

y_gaussian = gaussian(x_list, 50, 50, 10) + rng.random(len(x_list)) - rng.random(len(x_list))

y_gaussian[np.arange(0, 11)] = 10
y_gaussian[np.arange(90,100)] = 10

weight_list = np.ones(len(x_list))
weight_list[np.arange(30, 71)] = 100

model = models.GaussianModel()

output = model.fit(y_gaussian, x=x_list, weights=weight_list)

fig = plt.figure()
plt.clf()

plt.plot(x_list, y_gaussian, label="test")
plt.plot(x_list, output.best_fit, label="best_fit")

plt.legend()
plt.show()

print(output.fit_report())

実行結果
[[Model]]
    Model(gaussian)
[[Fit Statistics]]
    # fitting method   = leastsq
    # function evals   = 59
    # data points      = 100
    # variables        = 3
    chi-square         = 80087.7662
    reduced chi-square = 825.647075
    Akaike info crit   = 674.570820
    Bayesian info crit = 682.386331
    R-squared          = -51.5579250
[[Variables]]
    amplitude:  46.9354593 +/- 2.22925624 (4.75%) (init = 1)
    center:     49.2317876 +/- 0.54103068 (1.10%) (init = 0)
    sigma:      10.1700531 +/- 0.58602871 (5.76%) (init = 1)
    fwhm:       23.9486442 +/- 1.37999213 (5.76%) == '2.3548200*sigma'
    height:     1.84114479 +/- 0.08480693 (4.61%) == '0.3989423*amplitude/max(1e-15, sigma)'
[[Correlations]] (unreported correlations are < 0.100)
    C(amplitude, sigma) = +0.6311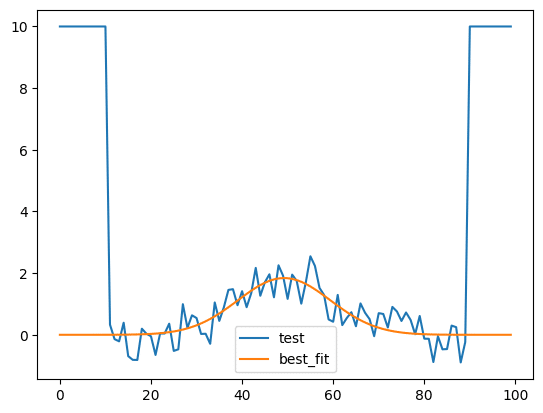
方法4:ftolの設定
次にftolの設定を紹介します。
ftolとは許容誤差のことで、要するにどれだけフィッティングできたら終了させるかという判断に使われる値です。
デフォルトは「1e-7(1×10⁻⁷)」で値が小さくなるほど、許容できる誤差が小さい、つまりよりフィットしないと終了しなくなります。
使う際は「model.fit(Yの値のリスト, x=Xの値のリスト, fit_kws={“ftol”:1e-22})」とします。
import numpy as np
import matplotlib.pyplot as plt
from lmfit.lineshapes import gaussian
from lmfit import models

x_list = np.arange(0, 100)

rng = np.random.default_rng()

y_gaussian = gaussian(x_list, 50, 50, 10) + rng.random(len(x_list)) - rng.random(len(x_list))

model = models.GaussianModel()

output = model.fit(y_gaussian, x=x_list, fit_kws={"ftol":1e-22})

fig = plt.figure()
plt.clf()

plt.plot(x_list, y_gaussian, label="test")
plt.plot(x_list, output.best_fit, label="best_fit")

plt.legend()
plt.show()

print(output.fit_report())

実行結果
[[Model]]
    Model(gaussian)
[[Fit Statistics]]
    # fitting method   = leastsq
    # function evals   = 8000
    # data points      = 100
    # variables        = 3
    chi-square         = 94.9685604
    reduced chi-square = 0.97905732
    Akaike info crit   = 0.83757075
    Bayesian info crit = 8.65308131
    R-squared          = -0.32460992
##  Warning: uncertainties could not be estimated:
[[Variables]]
    amplitude:  9.6670e+18 (init = 1)
    center:    -31.1292869 (init = 0)
    sigma:      3.37971151 (init = 1)
    fwhm:       7.95861226 == '2.3548200*sigma'
    height:     1.1411e+18 == '0.3989423*amplitude/max(1e-15, sigma)'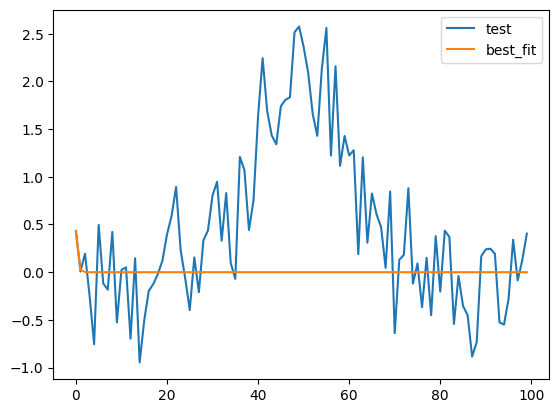
ただしいくら許容誤差を小さくしたからといって、必ずしもうまくフィッティングできる訳ではなく、思ったよりもうまく行かなかったりします。
とりあえずうまくフィッティングできなかったら試してみたらいいかなと思ったものを挙げてみました。
また何か見つけたら、どんどん追加していきます。
次回はPandasでcsvファイルを読み込んだ際の読み込む列の指定方法を紹介します。
ではでは今回はこんな感じで。

コメント