簡単に実行できるPythonプログラム
前々回から簡単に実行できるPythonプログラムを作成する方法の解説を行なっています。

前回までは準備段階。
今回からダブルクリックで実行できる形式に変更していきます。
とりあえず前回のおさらいから。
インポートしたライブラリは「matplotlib」と「csv」です。
from matplotlib import pyplot as plt
import csv
そしてメインのプログラムの部分がこちら。
filename = "testdata.csv"
output_fig = "out_fig.png"
output_data = "test_out.csv"

f = open(filename, "r")
reader = csv.reader(f)

x = []; y1 = []; y2 = []

for row in reader:
    x.append(int(row[0]))
    y1.append(int(row[1]))
    y2.append(int(row[2]))

f.close()

y1y2 = []

for y1_each, y2_each in zip(y1, y2):
    y1y2.append(y1_each*y2_each)

fig = plt.figure()

plt.plot(x, y1y2)

plt.savefig(output_fig)

f = open(output_data, "w")

for x_each, y1y2_each in zip(x, y1y2):
    f.write(str(x_each) + ",")
    f.write(str(y1y2_each) + "\n")

f.close()
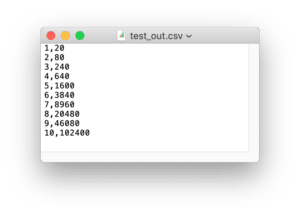
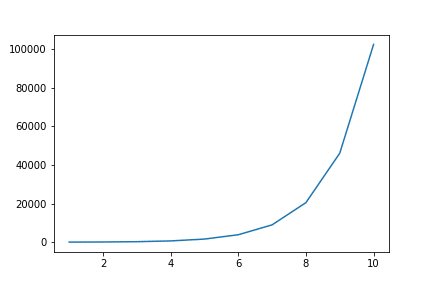
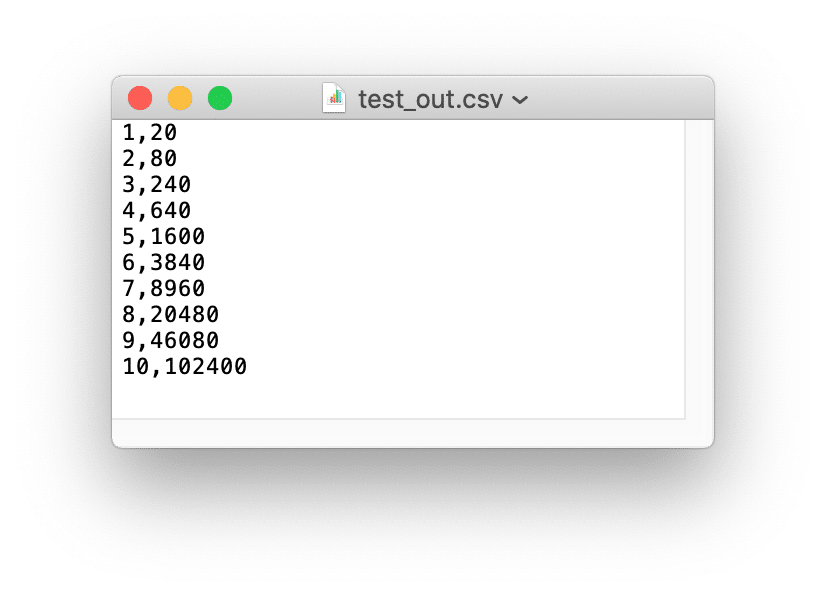
実行すると「out_fig.png」というグラフと「test_out.csv」というCSVファイルが作成されます。
<out_fig.png>

<test_out.csv>

ではではこれをダブルクリックで実行できるよう変更していきましょう。
main関数
Pythonでダブルクリックで実行可能なプログラムを作成する際には「main関数」と言うものが使われます。
基本的な書き方としては、こんな感じです。
if __name__ == '__main__':
    main()
詳しいことは私もよく分からなかったりしますが、これでPythonプログラムを起動すると「main()」 という処理が行われるということらしいです。
ではその「main()」とはなんななのか?
これは自分で「main()」という関数を作成して、ここで実行させるということです。
つまりこれまで作成したプログラム全体を「main()」という関数にしてしまうということです。
とは言っても、最初のファイル名を決める部分はいらないので、ここ以外の部分を「main()」として関数にしてしまいましょう。
そして最後に先ほどの「main()」の実行部分を追加します。
if __name__ == '__main__':
    main()
ということでプログラム全体としてはこんな感じになります。
from matplotlib import pyplot as plt
import csv

filename = "testdata.csv"
output_fig = "out_fig.png"
output_data = "test_out.csv"

def main():
    f = open(filename, "r")
    reader = csv.reader(f)

    x = []; y1 = []; y2 = []

    for row in reader:
        x.append(int(row[0]))
        y1.append(int(row[1]))
        y2.append(int(row[2]))

    f.close()

    y1y2 = []

    for y1_each, y2_each in zip(y1, y2):
        y1y2.append(y1_each*y2_each)

    fig = plt.figure()

    plt.plot(x, y1y2)

    plt.savefig(output_fig)

    f = open(output_data, "w")

    for x_each, y1y2_each in zip(x, y1y2):
        f.write(str(x_each) + ",")
        f.write(str(y1y2_each) + "\n")

    f.close()

if __name__ == '__main__':
    main()
これを実行すると、やはり「out_fig.png」と「test_out.csv」が作成されます。
Pythonプログラムとして保存
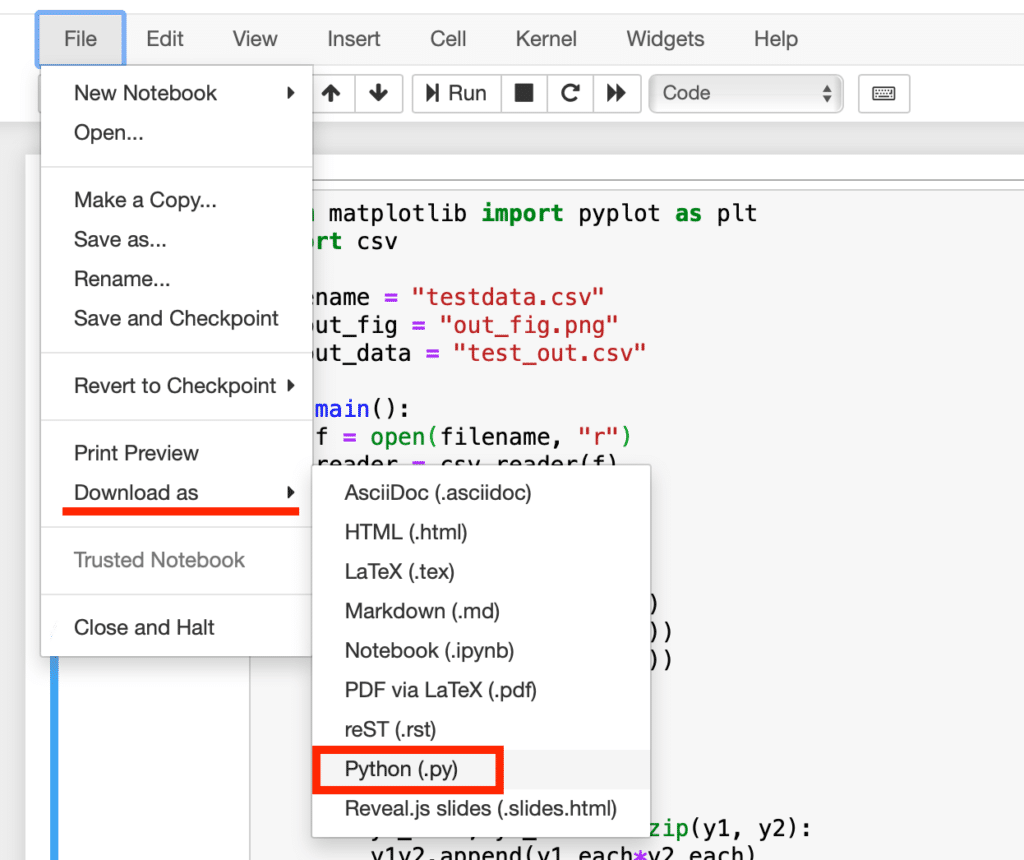
このままではまだAnacondaのプログラム(.ipynb)ですので、これをPythonプログラム(.py)として保存します。
「File」をクリック。

「Download as」をクリックし、「Python(.py)」をクリックします。

すると「タイトル.py」というファイルがダウンロードされます。
私は「test_program.py」として名前をつけました。
次回はこのプログラムの実行方法を解説していきます。

ということで今回はこんな感じで。

コメント