matplotlib
前回、matplotlibで風データ(風向、風速)をプロットするbarbsを紹介しました。
今回はmatplotlibでベクトル場を表示するquiverを紹介します。
それでは始めていきましょう。
matplotlib.quiverの基本
まずベクトル場を表示するquiverを使用するには、グラフ上のXの位置のリスト、Yの位置のリスト、ベクトルのX成分のリスト、ベクトルのY成分のリストが必要になります。
そして「plt.quiver(Xの位置のリスト, Yの位置のリスト, ベクトルのX成分のリスト, ベクトルのY成分のリスト)」とします。
import matplotlib.pyplot as plt

x_list = [1]
y_list = [1]
u_list = [1]
v_list = [2]

fig = plt.figure()
plt.clf()

plt.quiver(x_list, y_list, u_list, v_list)

plt.show()

実行結果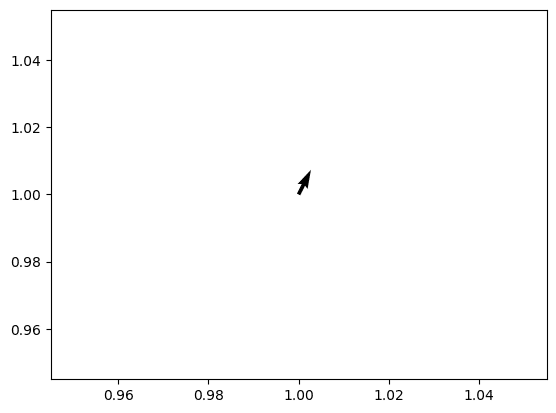
ただしこのままではベクトルのX成分、ベクトルのY成分がうまく反映されておらず、長さが正しく表示されていません。
またベクトルのX成分、ベクトルのY成分をそれぞれ10倍にしても表示は変わりません。
import matplotlib.pyplot as plt

x_list = [1]
y_list = [1]
u_list = [10]
v_list = [20]

fig = plt.figure()
plt.clf()

plt.quiver(x_list, y_list, u_list, v_list)

plt.show()

実行結果
そこで「angles=”xy”, scale_units=’xy’, scale=1」を追加します。
import matplotlib.pyplot as plt

x_list = [1]
y_list = [1]
u_list = [1]
v_list = [2]

fig = plt.figure()
plt.clf()

plt.quiver(x_list, y_list, u_list, v_list, angles="xy", scale_units='xy', scale=1)

plt.show()

実行結果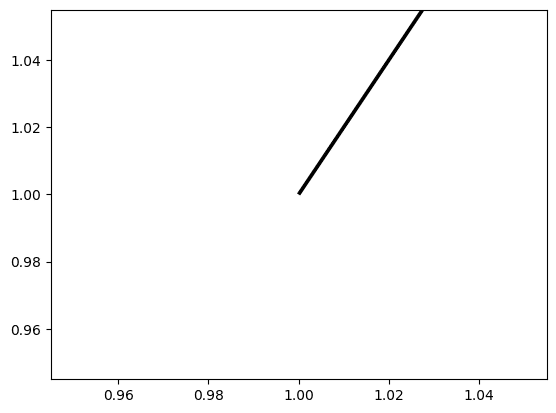
ただしこの様にベクトルの長さに対しては自動でXの範囲、Yの範囲を調整してくれないので、「plt.xlim」「plt.ylim」で調整します。
import matplotlib.pyplot as plt

x_list = [1]
y_list = [1]
u_list = [1]
v_list = [2]

fig = plt.figure()
plt.clf()

plt.quiver(x_list, y_list, u_list, v_list, angles="xy", scale_units='xy', scale=1)

plt.xlim(0, 5)
plt.ylim(0, 5)

plt.show()

実行結果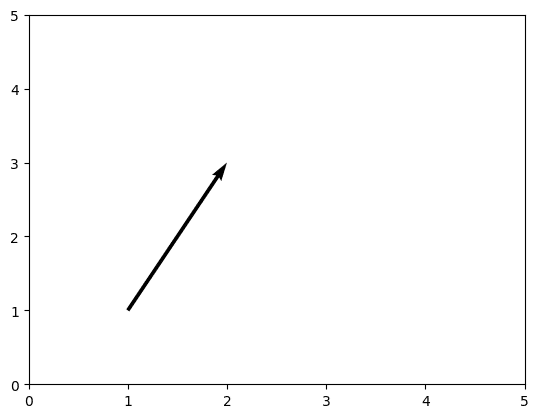
anglesはベクトルの方向を(x, y)から(x+u, y+v)に向けた方向にするという意味になります。
そのためanglesを定義しないとベクトルの方向がずれます。
import matplotlib.pyplot as plt

x_list = [1]
y_list = [1]
u_list = [1]
v_list = [2]

fig = plt.figure()
plt.clf()

plt.quiver(x_list, y_list, u_list, v_list, scale_units='xy', scale=1)

plt.xlim(0, 5)
plt.ylim(0, 5)

plt.show()

実行結果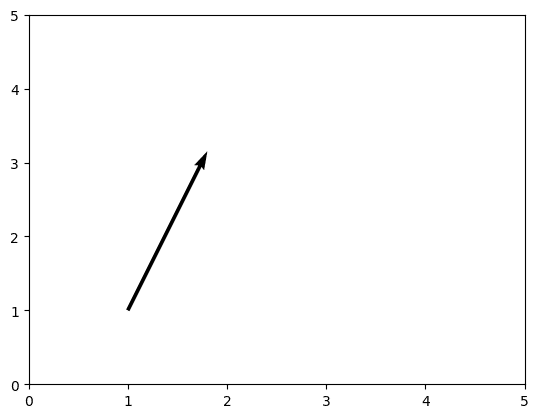
scale_unitsはu、vの長さの基準でscaleを定義した上で、こちらを無くすとデフォルトがNoneのため、ベクトルの長さが無限大になります。
import matplotlib.pyplot as plt

x_list = [1]
y_list = [1]
u_list = [1]
v_list = [2]

fig = plt.figure()
plt.clf()

plt.quiver(x_list, y_list, u_list, v_list, angles="xy", scale=1)

plt.xlim(0, 10)
plt.ylim(0, 10)

plt.show()

実行結果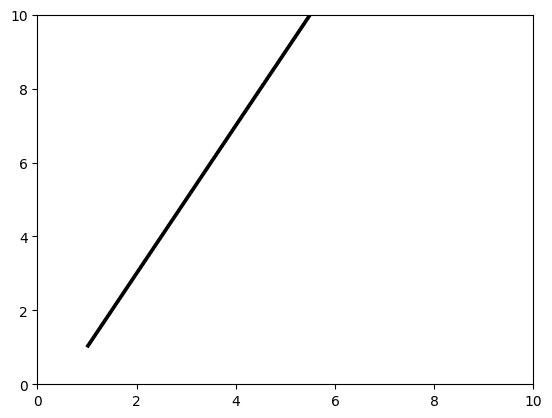
scaleはscale_unitsで指定した単位に対してのu、vの長さの比率です。
scale_unitsで「x,y」を指定した場合、x、yそれぞれを1としてu、vの長さが「u/scale」、「v/scale」となります。
つまり大きな値を指定するとベクトルの長さは短くなり、小さな値を指定するとベクトルの長さは長くなります。
import matplotlib.pyplot as plt

x_list = [1]
y_list = [1]
u_list = [1]
v_list = [2]

fig = plt.figure()
plt.clf()

plt.quiver(x_list, y_list, u_list, v_list, angles="xy", scale_units='xy', scale=2)

plt.xlim(0, 5)
plt.ylim(0, 5)

plt.show()

実行結果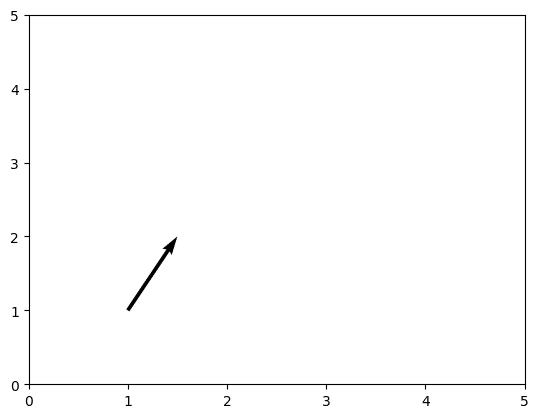
import matplotlib.pyplot as plt

x_list = [1]
y_list = [1]
u_list = [1]
v_list = [2]

fig = plt.figure()
plt.clf()

plt.quiver(x_list, y_list, u_list, v_list, angles="xy", scale_units='xy', scale=0.5)

plt.xlim(0, 5)
plt.ylim(0, 5)

plt.show()

実行結果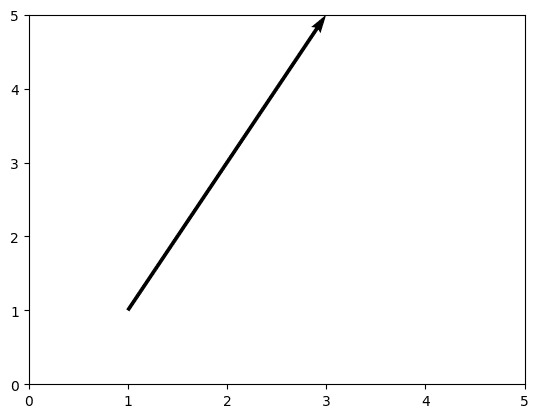
複数のベクトルを同時に表示
複数のベクトルを同時に表示するには、それぞれのリストに新たな要素を追加します。
import matplotlib.pyplot as plt

x_list = [1, 2]
y_list = [1, 1]
u_list = [1, 2]
v_list = [2, 1]

fig = plt.figure()
plt.clf()

plt.quiver(x_list, y_list, u_list, v_list, angles="xy", scale_units='xy', scale=1)

plt.xlim(0, 10)
plt.ylim(0, 10)

plt.show()

実行結果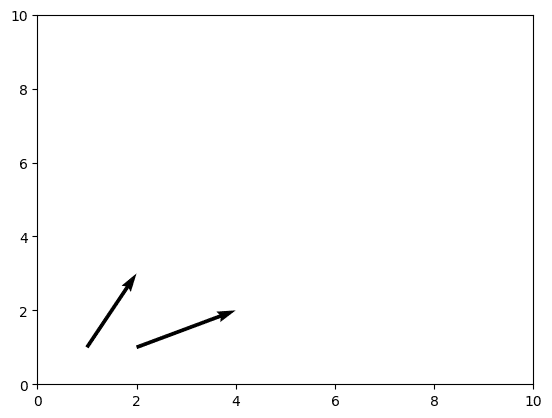
ただしグラフ上のXの位置のリスト、Yの位置のリストの要素数とベクトルのX成分のリスト、ベクトルのY成分のリストの要素数が合わない場合、エラーとなります。
import matplotlib.pyplot as plt

x_list = [1, 2, 3]
y_list = [1, 1, 1]
u_list = [1, 2]
v_list = [2, 1]

fig = plt.figure()
plt.clf()

plt.quiver(x_list, y_list, u_list, v_list, angles="xy", scale_units='xy', scale=1)

plt.xlim(0, 10)
plt.ylim(0, 10)

plt.show()

実行結果
---------------------------------------------------------------------------
ValueError                                Traceback (most recent call last)
Cell In[14], line 11
      8 fig = plt.figure()
      9 plt.clf()
---> 11 plt.quiver(x_list, y_list, u_list, v_list, angles="xy", scale_units='xy', scale=1)
     13 plt.xlim(0, 10)
     14 plt.ylim(0, 10)

(中略)

ValueError: Argument U has a size 2 which does not match 3, the number of arrow positions
一つ例外があり、グラフ上のXの位置のリスト、Yの位置のリストの要素が複数存在し、ベクトルのX成分のリスト、ベクトルのY成分のリストの要素数がそれぞれ一つの場合、すべてのベクトルの成分がその一つの成分となります。
import matplotlib.pyplot as plt

x_list = [1, 2, 3]
y_list = [1, 1, 1]
u_list = [1]
v_list = [2]

fig = plt.figure()
plt.clf()

plt.quiver(x_list, y_list, u_list, v_list, angles="xy", scale_units='xy', scale=1)

plt.xlim(0, 10)
plt.ylim(0, 10)

plt.show()

実行結果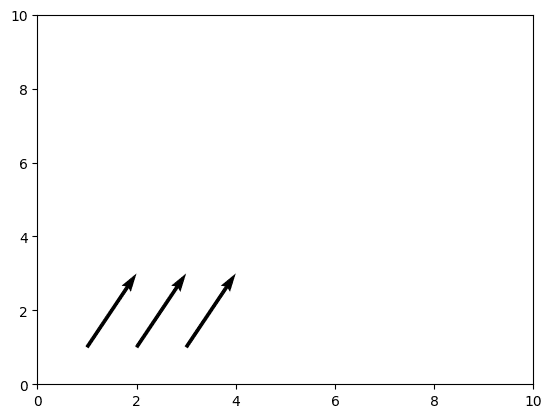
ベクトルの太さの変更
ベクトルの太さを変更するにはオプション引数として「width」を追加します。
import matplotlib.pyplot as plt

x_list = [1, 2]
y_list = [1, 1]
u_list = [1, 2]
v_list = [2, 1]

fig = plt.figure()
plt.clf()

plt.quiver(x_list, y_list, u_list, v_list, angles="xy", scale_units='xy', scale=1, width=0.001)

plt.xlim(0, 10)
plt.ylim(0, 10)

plt.show()

実行結果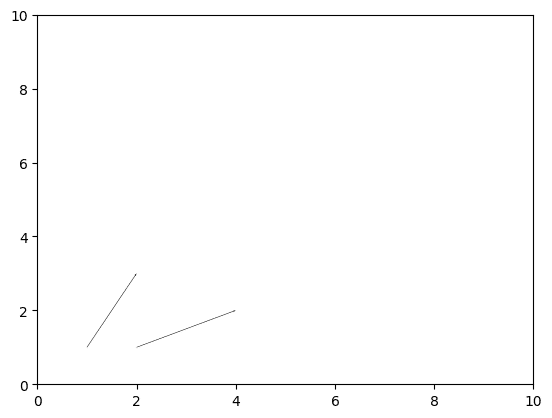
ただしそれぞれのベクトルの太さを個別に変えることはできません。
例えばwidthの引数をリストにして別々の値を与え、それぞれ太さを変えようとしてもエラーとなるだけです。
import matplotlib.pyplot as plt

x_list = [1, 2]
y_list = [1, 1]
u_list = [1, 2]
v_list = [2, 1]

fig = plt.figure()
plt.clf()

plt.quiver(x_list, y_list, u_list, v_list, angles="xy", scale_units='xy', scale=1, width=[0.001, 0.01])

plt.xlim(0, 10)
plt.ylim(0, 10)

plt.show()

実行結果
---------------------------------------------------------------------------
ValueError                                Traceback (most recent call last)
File /Library/Frameworks/Python.framework/Versions/3.10/lib/python3.10/site-packages/IPython/core/formatters.py:343, in BaseFormatter.__call__(self, obj)
    341     pass
    342 else:
--> 343     return printer(obj)
    344 # Finally look for special method names
    345 method = get_real_method(obj, self.print_method)

(中略)

ValueError: operands could not be broadcast together with shapes (2,8) (2,)
矢尻のサイズの変更
ベクトルの矢尻の太さを変更するにはオプション引数として「headwidth」を追加します。
import matplotlib.pyplot as plt

x_list = [1, 2]
y_list = [1, 1]
u_list = [1, 2]
v_list = [2, 1]

fig = plt.figure()
plt.clf()

plt.quiver(x_list, y_list, u_list, v_list, angles="xy", scale_units='xy', scale=1, headwidth=10)

plt.xlim(0, 10)
plt.ylim(0, 10)

plt.show()

実行結果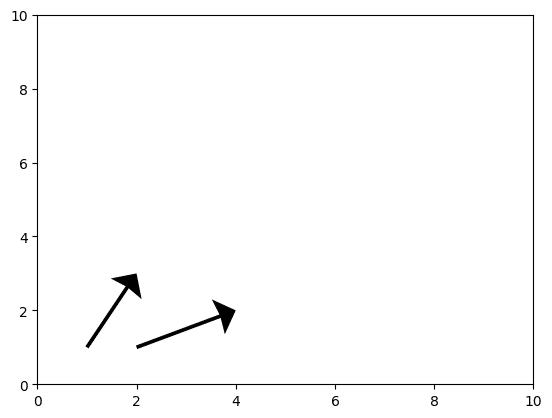
矢尻の長さを変更するにはオプション引数として「headlength」を追加します。
import matplotlib.pyplot as plt

x_list = [1, 2]
y_list = [1, 1]
u_list = [1, 2]
v_list = [2, 1]

fig = plt.figure()
plt.clf()

plt.quiver(x_list, y_list, u_list, v_list, angles="xy", scale_units='xy', scale=1, headlength=1)

plt.xlim(0, 10)
plt.ylim(0, 10)

plt.show()

実行結果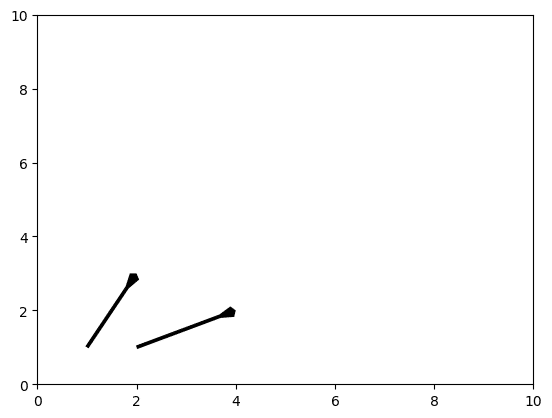
矢尻の深さを変更するにはオプション引数として「headaxislength」を追加します。
import matplotlib.pyplot as plt

x_list = [1, 2]
y_list = [1, 1]
u_list = [1, 2]
v_list = [2, 1]

fig = plt.figure()
plt.clf()

plt.quiver(x_list, y_list, u_list, v_list, angles="xy", scale_units='xy', scale=1, headaxislength=1)

plt.xlim(0, 10)
plt.ylim(0, 10)

plt.show()

実行結果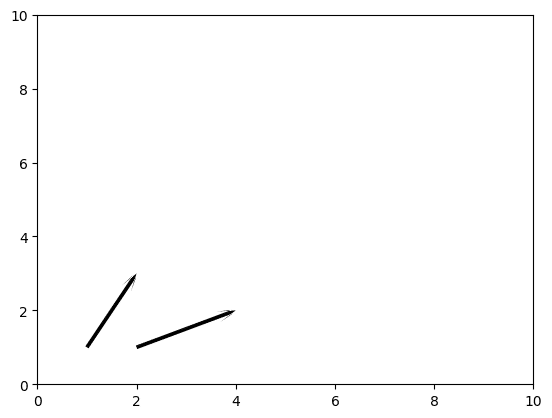
ベクトルの矢印の形に関しては公式サイトに詳しく載っていますので、そちらをみてもらえるとより理解しやすいと思います。
色の変更
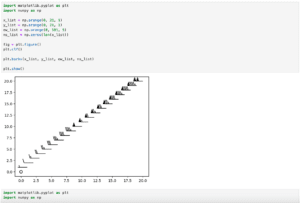
複数のベクトルに対し、色を変更するにはカラーマップの色を指定するための数値データのリストを準備します。
今回はXの値のリストで代用します。
import matplotlib.pyplot as plt

x_list = [1, 3, 5, 7, 9]
y_list = [1, 1, 1, 1, 1]
u_list = [1, 1, 1, 1, 1]
v_list = [2, 2, 2, 2, 2]

fig = plt.figure()
plt.clf()

plt.quiver(x_list, y_list, u_list, v_list, x_list, angles="xy", scale_units='xy', scale=1)

plt.xlim(0, 11)
plt.ylim(0, 6)

plt.show()

実行結果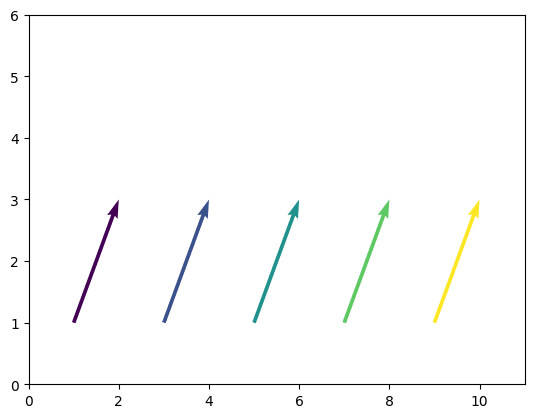
カラーマップを指定しない場合は「viridis」が使われます。
また「cmap=カラーマップ」を引数に追加すると、指定したカラーマップを使用できます。
import matplotlib.pyplot as plt

x_list = [1, 3, 5, 7, 9]
y_list = [1, 1, 1, 1, 1]
u_list = [1, 1, 1, 1, 1]
v_list = [2, 2, 2, 2, 2]

fig = plt.figure()
plt.clf()

plt.quiver(x_list, y_list, u_list, v_list, x_list, angles="xy", scale_units='xy', scale=1, cmap="rainbow")

plt.xlim(0, 11)
plt.ylim(0, 6)

plt.show()

実行結果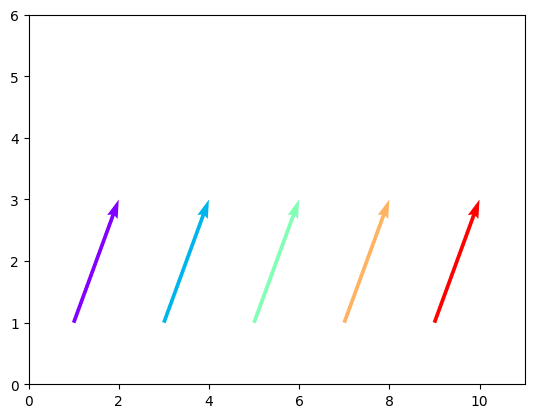
一つずつ指定することも可能で、その場合は色のリストを準備し、「color= 色のリスト」を追加します。
import matplotlib.pyplot as plt

x_list = [1, 3, 5, 7, 9]
y_list = [1, 1, 1, 1, 1]
u_list = [1, 1, 1, 1, 1]
v_list = [2, 2, 2, 2, 2]

fig = plt.figure()
plt.clf()

colors = ["tab:blue", "tab:orange", "tab:green", "tab:red", "tab:purple"]

plt.quiver(x_list, y_list, u_list, v_list, color=colors, angles="xy", scale_units='xy', scale=1)

plt.xlim(0, 11)
plt.ylim(0, 6)

plt.show()

実行結果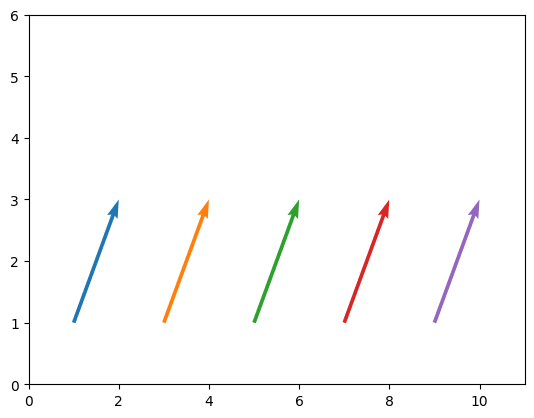
次回はmatplotlibでステップワイズグラフ(階段状のグラフ)を表示するstairsを紹介します。
ではでは今回はこんな感じで。
コメント