matplotlib
前回、memory-profilerによるメモリ使用量の分析方法を紹介しました。
今回はmatplotlibで大量の画像を作成する場合のメモリリークをしにくい方法を紹介します。
ちなみに同様の話題として、こちら記事もありますのでよかったらどうぞ。
こちらの記事では「fig = plt.figure()」を繰り返さないことでメモリ使用量が増大しないということを紹介しました。
ただ時には「fig = plt.figure()」を繰り返さざるを得ない状況もあるかもしれません。
今回はそんな状況に対応する方法を紹介します。
それでは始めていきましょう。
メモリリークするコード
まずはメモリリークするコードです。
グラフを生成するため「plt.savefig()」をしますが、「plt.close()」をしないコード(python-matplotlib-104-1.py)です。
import matplotlib.pyplot as plt
import numpy as np
from memory_profiler import profile
import os

num_graph = 100

default_dirpath = os.getcwd()

@profile
def graphGenerator(num_graph):
    for i in range(num_graph):
        x_list = np.arange(0, 1000)

        rng = np.random.default_rng()
        y_list = [rng.random() for _ in x_list]

        fig = plt.figure()
        plt.clf()

        plt.plot(x_list, y_list)

        filename = str(i).zfill(10) + ".png"
        plt.savefig(os.path.join(default_dirpath, filename))

graphGenerator(num_graph)
このコードを使って「mprof run ./python-matplotlib-104-1.py」を実行すると次の結果が得られます。
mprof: Sampling memory every 0.1s
running new process
running as a Python program...
./python-matplotlib-104-1.py:34: RuntimeWarning: More than 20 figures
have been opened. Figures created through the pyplot interface
(`matplotlib.pyplot.figure`) are retained until explicitly closed and
may consume too much memory. (To control this warning, see the
rcParam `figure.max_open_warning`). Consider using
`matplotlib.pyplot.close()`.
  fig = plt.figure()
Filename: ./python-matplotlib-104-1.py

Line #    Mem usage    Increment  Occurrences   Line Contents
=============================================================
    26     85.6 MiB     85.6 MiB           1   @profile
    27                                         def graphGenerator(num_graph):
    28    865.3 MiB      0.0 MiB         101       for i in range(num_graph):
    29    856.7 MiB      0.0 MiB         100           x_list = np.arange(0, 1000)
    30
    31    856.7 MiB      2.4 MiB         100           rng = np.random.default_rng()
    32    856.7 MiB      0.7 MiB      100100           y_list = [rng.random() for _ in x_list]
    33
    34    857.1 MiB     63.2 MiB         100           fig = plt.figure()
    35    857.1 MiB      0.0 MiB         100           plt.clf()
    36
    37    857.3 MiB     23.6 MiB         100           plt.plot(x_list, y_list)
    38
    39    857.3 MiB      0.0 MiB         100           filename = str(i).zfill(10) + ".png"
    40    865.3 MiB    689.7 MiB         100           plt.savefig(os.path.join(default_dirpath, filename))
さらに「mprof plot」で経時変化を見てみましょう。
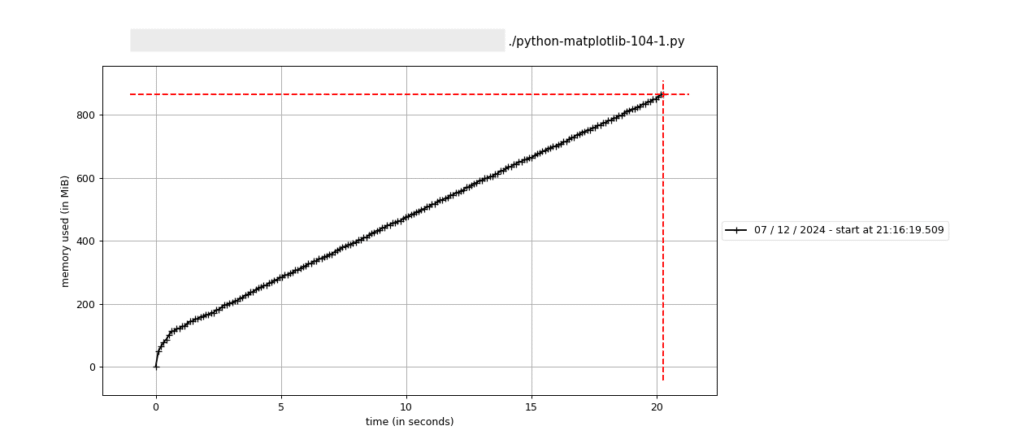
見事なまでの右肩上がりです。
つまりこのままもっと大量のグラフを生成するとメモリがパンクすると考えられます。
plt.close()
先ほどのコードを実行するとこちらの警告が出ていました。
./python-matplotlib-104-1.py:34: RuntimeWarning: More than 20 figures
have been opened. Figures created through the pyplot interface
(`matplotlib.pyplot.figure`) are retained until explicitly closed and
may consume too much memory. (To control this warning, see the
rcParam `figure.max_open_warning`). Consider using
`matplotlib.pyplot.close()`.
どうやら20以上のグラフを同時に開くとメモリを大量消費してしまうので、「plt.close()」を使ってグラフを閉じることを推奨しているようです。
ということで「plt.close()」を追加してみました(python-matplotlib-104-2.py)。
import matplotlib.pyplot as plt
import numpy as np
from memory_profiler import profile
import os

num_graph = 100

default_dirpath = os.getcwd()

@profile
def graphGenerator(num_graph):
    for i in range(num_graph):
        x_list = np.arange(0, 1000)

        rng = np.random.default_rng()
        y_list = [rng.random() for _ in x_list]

        fig = plt.figure()
        plt.clf()

        plt.plot(x_list, y_list)

        filename = str(i).zfill(10) + ".png"
        plt.savefig(os.path.join(default_dirpath, filename))
        plt.close()

graphGenerator(num_graph)
このコードを使って「mprof run ./python-matplotlib-104-2.py」を実行すると次の結果が得られます。
mprof: Sampling memory every 0.1s
running new process
running as a Python program...
Filename: ./python-matplotlib-104-2.py

Line #    Mem usage    Increment  Occurrences   Line Contents
=============================================================
    26     84.6 MiB     84.6 MiB           1   @profile
    27                                         def graphGenerator(num_graph):
    28    329.0 MiB      0.0 MiB         101       for i in range(num_graph):
    29    328.8 MiB      0.0 MiB         100           x_list = np.arange(0, 1000)
    30
    31    328.8 MiB      2.5 MiB         100           rng = np.random.default_rng()
    32    328.8 MiB      0.2 MiB      100100           y_list = [rng.random() for _ in x_list]
    33
    34    329.0 MiB     48.2 MiB         100           fig = plt.figure()
    35    329.0 MiB      0.0 MiB         100           plt.clf()
    36
    37    329.0 MiB      5.8 MiB         100           plt.plot(x_list, y_list)
    38
    39    329.0 MiB      0.0 MiB         100           filename = str(i).zfill(10) + ".png"
    40    329.0 MiB    187.4 MiB         100           plt.savefig(os.path.join(default_dirpath, filename))
    41    329.0 MiB      0.1 MiB         100           plt.close()
さらに「mprof plot」で経時変化を見てみます。
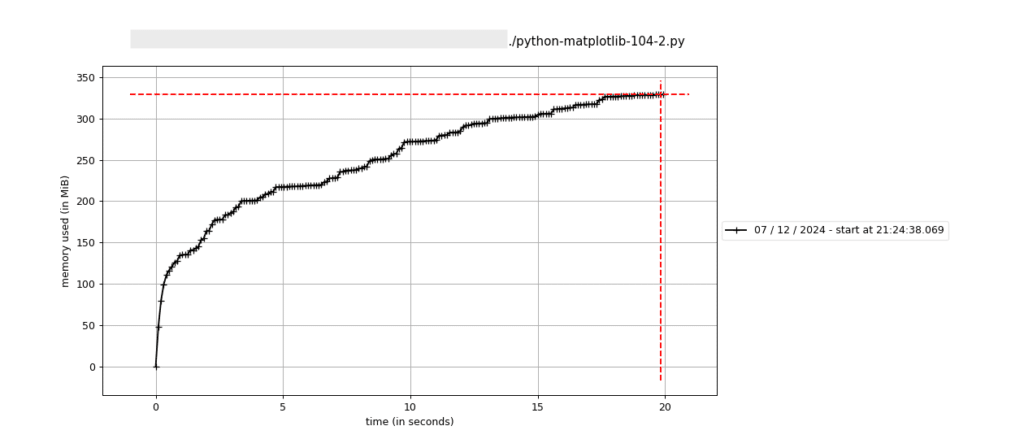
上がってはいるものの、ある程度のところで頭打ちになっている感じがします。
使用しているメモリ量としても350 MB程度で、先ほどの865 MBと比べると半分以下に抑えられています。
plt.clf()→plt.close()
こちらのQiitaの記事によると、「plt.close()」だけではメモリが解放されない場合もあり、その場合は「plt.clf()としてからplt.close()」とすると良いとのことでした。

ということで今回のプログラムでも試してみます(python-matplotlib-104-3.py)。
import matplotlib.pyplot as plt
import numpy as np
from memory_profiler import profile
import os

num_graph = 100

default_dirpath = os.getcwd()

@profile
def graphGenerator(num_graph):
    for i in range(num_graph):
        x_list = np.arange(0, 1000)

        rng = np.random.default_rng()
        y_list = [rng.random() for _ in x_list]

        fig = plt.figure()
        plt.clf()

        plt.plot(x_list, y_list)

        filename = str(i).zfill(10) + ".png"
        plt.savefig(os.path.join(default_dirpath, filename))

        plt.clf()
        plt.close()

graphGenerator(num_graph)
このコードを使って「mprof run ./python-matplotlib-104-3.py」を実行し、「mprof plot」で経時変化を見てみます。
mprof: Sampling memory every 0.1s
running new process
running as a Python program...
Filename: ./python-matplotlib-104-3.py

Line #    Mem usage    Increment  Occurrences   Line Contents
=============================================================
    26     84.8 MiB     84.8 MiB           1   @profile
    27                                         def graphGenerator(num_graph):
    28    316.5 MiB      0.0 MiB         101       for i in range(num_graph):
    29    316.3 MiB      0.0 MiB         100           x_list = np.arange(0, 1000)
    30
    31    316.3 MiB      2.5 MiB         100           rng = np.random.default_rng()
    32    316.3 MiB      0.2 MiB      100100           y_list = [rng.random() for _ in x_list]
    33
    34    316.5 MiB     44.9 MiB         100           fig = plt.figure()
    35    316.5 MiB      0.0 MiB         100           plt.clf()
    36
    37    316.5 MiB      2.6 MiB         100           plt.plot(x_list, y_list)
    38
    39    316.5 MiB      0.0 MiB         100           filename = str(i).zfill(10) + ".png"
    40    316.5 MiB    181.2 MiB         100           plt.savefig(os.path.join(default_dirpath, filename))
    41
    42    316.5 MiB      0.1 MiB         100           plt.clf()
    43    316.5 MiB      0.2 MiB         100           plt.close()
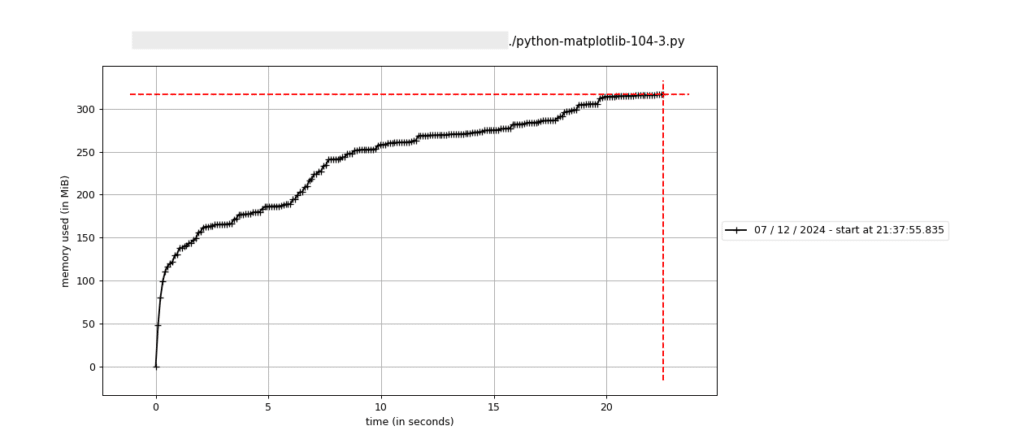
思ったよりメモリ使用量は減らずに320 MB程度となりました。
ただ今回は「plt.close()」だけでもメモリリークをしていないので、それが差が出なかった原因じゃないかと考えられます。
fig = plt.figure()を繰り返さない方法
最後に前に紹介した「fig = plt.figure()を繰り返さない」方法も試してみましょう(python-matplotlib-104-4.py)。
import matplotlib.pyplot as plt
import numpy as np
from memory_profiler import profile
import os

num_graph = 100

default_dirpath = os.getcwd()

@profile
def graphGenerator(num_graph):
    for i in range(num_graph):
        x_list = np.arange(0, 1000)

        rng = np.random.default_rng()
        y_list = [rng.random() for _ in x_list]

        plt.clf()

        plt.plot(x_list, y_list)

        filename = str(i).zfill(10) + ".png"
        plt.savefig(os.path.join(default_dirpath, filename))

        plt.close()

fig = plt.figure()
graphGenerator(num_graph)
このコードを使って「mprof run ./python-matplotlib-104-4.py」を実行し、「mprof plot」で経時変化を見てみます。
mprof: Sampling memory every 0.1s
running new process
running as a Python program...
Filename: ./python-matplotlib-104-4.py

Line #    Mem usage    Increment  Occurrences   Line Contents
=============================================================
    26    108.2 MiB    108.2 MiB           1   @profile
    27                                         def graphGenerator(num_graph):
    28    325.4 MiB      0.0 MiB         101       for i in range(num_graph):
    29    325.2 MiB      0.0 MiB         100           x_list = np.arange(0, 1000)
    30
    31    325.2 MiB      2.4 MiB         100           rng = np.random.default_rng()
    32    325.2 MiB      0.1 MiB      100100           y_list = [rng.random() for _ in x_list]
    33
    34    325.3 MiB     25.0 MiB         100           plt.clf()
    35
    36    325.3 MiB      6.1 MiB         100           plt.plot(x_list, y_list)
    37
    38    325.3 MiB      0.0 MiB         100           filename = str(i).zfill(10) + ".png"
    39    325.4 MiB    183.2 MiB         100           plt.savefig(os.path.join(default_dirpath, filename))
    40
    41    325.4 MiB      0.2 MiB         100           plt.close()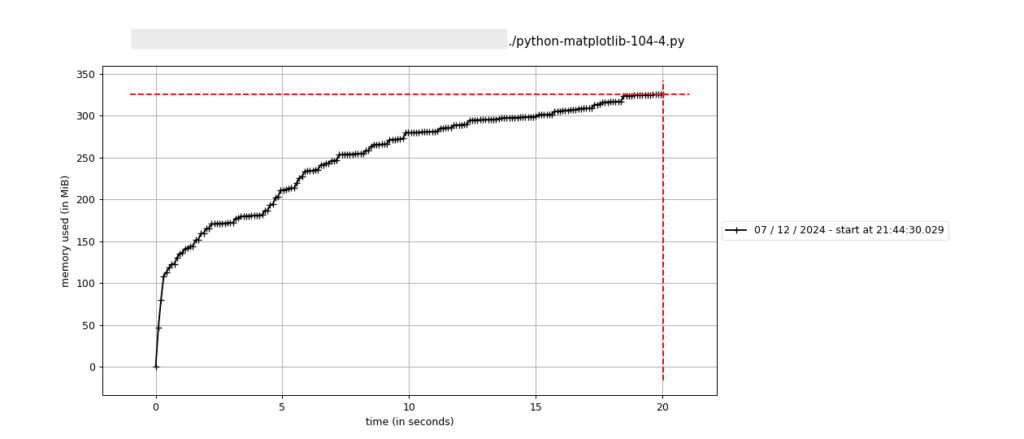
こちらもメモリ使用量は350 MBとなり、大きな変化はありませんでした。
先ほどもお話しした通り、メモリリークしていないので、こんなものかなと思われます。
もしmatplotlibでグラフを出力するとメモリ不足で落ちてしまうなんて人がいましたら、今回紹介した方法を試してもらえると解消するかもしれません。
次回は最近Mac miniを購入し、その際にHomebrewを使ってpyenvをインストール、Pythonプログラミング環境を構築したので、その方法を紹介します。
ではでは今回はこんな感じで。
コメント