matplotlib
前回、Pythonで1次元のリストを2次元のリストに変換する方法を紹介しました。
今回はmatplotlibでX軸を2本にした場合の目盛りを傾ける方法を紹介します。
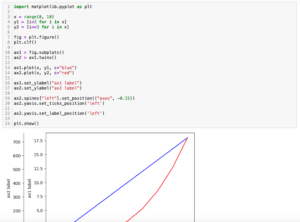
まずX軸をグラフの上下に1本ずつ、計2本あるグラフを描きます。
それには「ax1 = fig.subplots()」と「ax2 = ax1.twiny()」を用います(ax1.twinx()でないことに注意)。
import matplotlib.pyplot as plt

x1 = range(0, 10)
y1 = [i*2 for i in x1]

x2 = range(0, 100)
y2 = [i*1.1 for i in x2]

fig = plt.figure()
plt.clf()

ax1 = fig.subplots()
ax2 = ax1.twiny()

ax1.plot(x1, y1, color="blue")
ax2.plot(x2, y2, color="red")

plt.show()

実行結果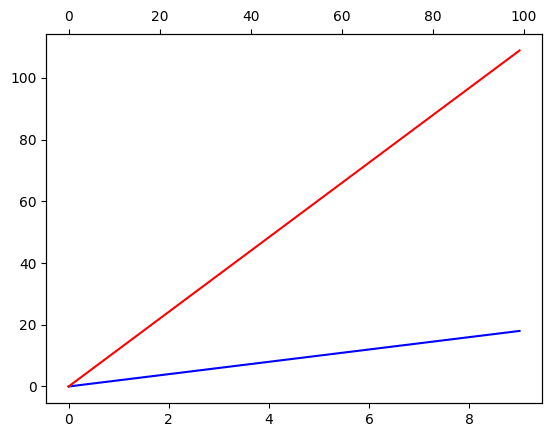
X軸の目盛りを傾ける方法
通常のX軸、Y軸がそれぞれ1本のグラフの場合、X軸の目盛りを傾けるには「plt.xticks(rotation=角度)」を使います。
実はX軸が2本のグラフでも「plt.xticks(rotation=角度)」を使うことはできます。
import matplotlib.pyplot as plt

x1 = range(0, 10)
y1 = [i*2 for i in x1]

x2 = range(0, 100)
y2 = [i*1.1 for i in x2]

fig = plt.figure()
plt.clf()

ax1 = fig.subplots()
ax2 = ax1.twiny()

ax1.plot(x1, y1, color="blue")
ax2.plot(x2, y2, color="red")

plt.xticks(rotation=90)

plt.show()

実行結果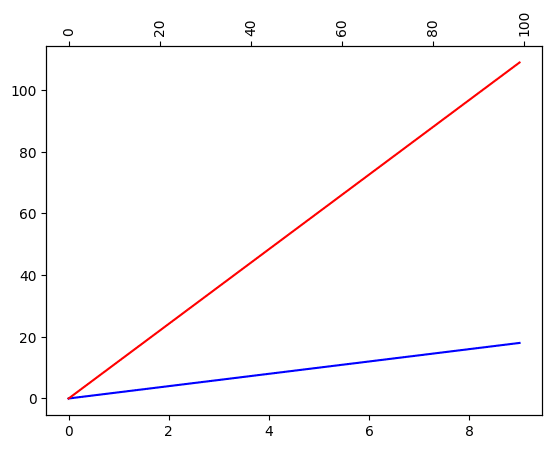
しかしこのままでは下のX軸の目盛りを傾けることができません。
下のX軸の目盛りを傾けるには「plt.setp(ax1.get_xticklabels(), rotation=角度)」を用います。
まず「plt.setp(オブジェクト, プロパティ)」で、対象のオブジェクトに対してプロパティを設定します。
上記の例では「ax1.get_xticklabels()」というオブジェクトに対して「rotation=角度」というプロパティを設定しているわけです。
そして「ax1.get_xticklabels()」ではax1のX軸の目盛りのオブジェクトを取得しています。
これでax1のX軸の目盛りを傾けるという設定を行っているのです。
ちなみに上のX軸ラベルの目盛りを傾けたい場合は「plt.setp(ax2.get_xticklabels(), rotation=角度)」となります。
import matplotlib.pyplot as plt

x1 = range(0, 10)
y1 = [i*2 for i in x1]

x2 = range(0, 100)
y2 = [i*1.1 for i in x2]

fig = plt.figure()
plt.clf()

ax1 = fig.subplots()
ax2 = ax1.twiny()

ax1.plot(x1, y1, color="blue")
ax2.plot(x2, y2, color="red")

plt.setp(ax2.get_xticklabels(), rotation=90)

plt.show()

実行結果
Y軸のメモリを傾ける方法
先ほどの「plt.setp()」を工夫するとY軸のメモリを傾けることもできます。
今回のグラフではY軸は1本なので「plt.setp(ax1.get_yticklabels(), rotation=角度)」です。
import matplotlib.pyplot as plt

x1 = range(0, 10)
y1 = [i*2 for i in x1]

x2 = range(0, 100)
y2 = [i*1.1 for i in x2]

fig = plt.figure()
plt.clf()

ax1 = fig.subplots()
ax2 = ax1.twiny()

ax1.plot(x1, y1, color="blue")
ax2.plot(x2, y2, color="red")

plt.setp(ax1.get_yticklabels(), rotation=90)

plt.show()

実行結果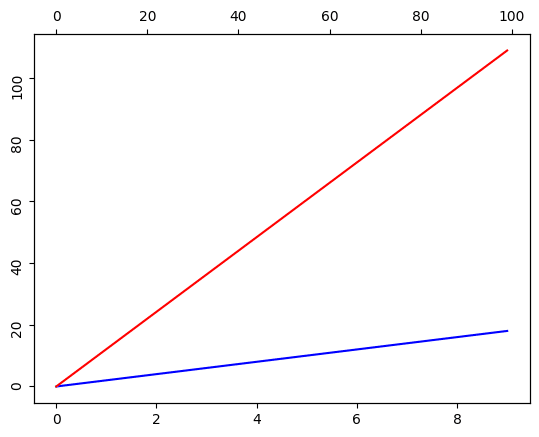
ちなみに今回はY軸の2本目は存在しないので「plt.setp(ax2.get_yticklabels(), rotation=角度)」としても何も起こりません(エラーにもなりません)。
import matplotlib.pyplot as plt

x1 = range(0, 10)
y1 = [i*2 for i in x1]

x2 = range(0, 100)
y2 = [i*1.1 for i in x2]

fig = plt.figure()
plt.clf()

ax1 = fig.subplots()
ax2 = ax1.twiny()

ax1.plot(x1, y1, color="blue")
ax2.plot(x2, y2, color="red")

plt.setp(ax2.get_yticklabels(), rotation=90)

plt.show()

実行結果
次回はmatplotlibでY軸を2本にした際、Y軸を片側に寄せる方法を紹介します。
ではでは今回はこんな感じで。
コメント