matplotlib
前回、Pythonのmatplotlibで斜体(イタリック)文字、上付き文字、下付き文字を使う方法を紹介しました。
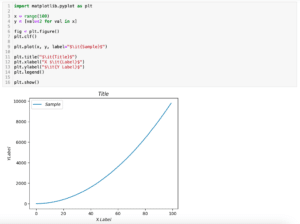
今回はmatplotlibでギリシャ文字を表示する方法を紹介します。
それでは始めていきましょう。
小文字のギリシャ文字を表示する方法
まずは小文字のギリシャ文字を使う方法です。
この場合、「alpha」、「beta」、「gamma」とそのままギリシャ文字の英語表記で「$\ギリシャ文字$」とします。
import matplotlib.pyplot as plt

x = range(100)
y = [val**2 for val in x]

fig = plt.figure()
plt.clf()

plt.plot(x, y, label=r"$\alpha$")

plt.title(r"$\beta$")
plt.xlabel(r"$\gamma$")
plt.ylabel(r"$\delta$")
plt.legend()

plt.show()

実行結果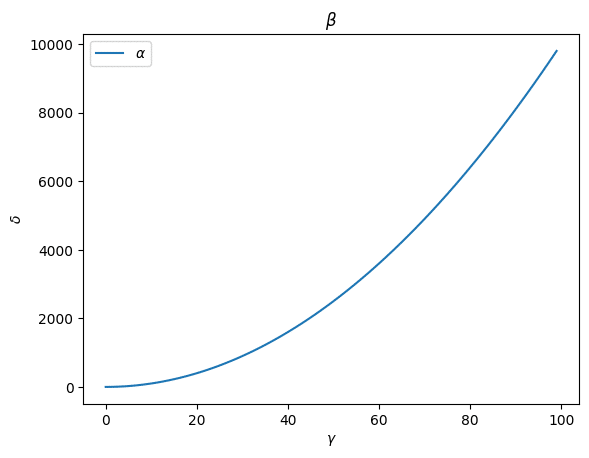
大文字のギリシャ文字を表示する方法
大文字のギリシャ文字に関してはアルファベットと重なる場合はアルファベットの大文字のみを「$」で囲みます。
つまり「$A$」、「$B$」のようになります。
間違えやすいのはこの場合「\(バックスラッシュ)」は不要である点です。
ギリシャ文字にしかない場合はギリシャ文字の英語表記で最初の文字を大文字にします。
つまり「$\Gamma$」、「$\Delta$」のようになります。
import matplotlib.pyplot as plt

x = range(100)
y = [val**2 for val in x]

fig = plt.figure()
plt.clf()

plt.plot(x, y, label=r"$A$")

plt.title(r"$B$")
plt.xlabel(r"$\Gamma$")
plt.ylabel(r"$\Delta$")
plt.legend()

plt.show()

実行結果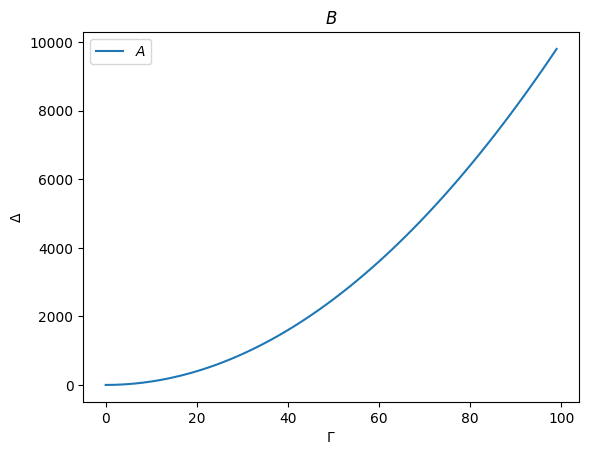
| 小文字 | 大文字 | |||
| アルファ | α | $\alpha$ | Α | $A$ |
| ベータ | β | $\beta$ | Β | $B$ |
| ガンマ | γ | $\gamma$ | Γ | $\Gamma$ |
| デルタ | δ | $\delta$ | Δ | $\Delta$ |
| イプシロン | ε | $\epsilon$ | Ε | $E$ |
| ゼータ | ζ | $\zeta$ | Ζ | $Z$ |
| イータ | η | $\eta$ | Η | $E$ |
| シータ | θ | $\theta$ | Θ | $\Theta$ |
| イオタ | ι | $\iota$ | Ι | $I$ |
| カッパ | κ | $\kappa$ | Κ | $K$ |
| ラムダ | λ | $\lambda$ | Λ | $\Lambda$ |
| ミュー | μ | $\mu$ | Μ | $M$ |
| ニュー | ν | $\nu$ | Ν | $N$ |
| クサイ | ξ | $\xi$ | Ξ | $\Xi$ |
| オミクロン | ο | $\omicron$ | O | $O$ |
| パイ | π | $\pi$ | Π | $\Pi$ |
| ロー | ρ | $\rho$ | Ρ | $P$ |
| シグマ | σ | $\sigma$ | Σ | $\Sigma$ |
| タウ | τ | $\tau$ | Τ | $\T$ |
| ウプシロン | υ | $\upsilon$ | Υ | $\Upsilon$ |
| ファイ | φ | $\phi$ | Φ | $\Phi$ |
| カイ | χ | $\chi$ | Χ | $X$ |
| プサイ | ψ | $\psi$ | Ψ | $Psi$ |
| オメガ | ω | $\omega$ | Ω | $\Omega$ |
連続した複数のギリシャ文字を表示する方法
ギリシャ文字を連続して入力する場合は、「$ギリシャ文字1 ギリシャ文字2$」の様に半角スペースを入れてそれぞれのギリシャ文字の表記を入力すると連続した複数のギリシャ文字を表示することができます。
import matplotlib.pyplot as plt

x = range(100)
y = [val**2 for val in x]

fig = plt.figure()
plt.clf()

plt.plot(x, y, label=r"$\alpha A$")

plt.title(r"$\beta B$")
plt.xlabel(r"$\gamma \Gamma$")
plt.ylabel(r"$\delta \Delta$")
plt.legend()

plt.show()

実行結果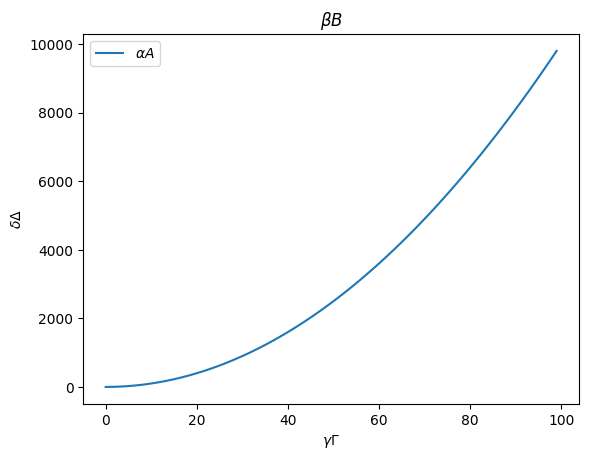
ちなみにこの場合、出力には半角スペースは現れませんのでご注意ください。
また「\(バックスラッシュ)」が必要なギリシャ文字の場合は半角スペースを開けなくても正しく出力することができます。
import matplotlib.pyplot as plt

x = range(100)
y = [val**2 for val in x]

fig = plt.figure()
plt.clf()

plt.plot(x, y, label=r"$\alpha A$")

plt.title(r"$\beta B$")
plt.xlabel(r"$\gamma\Gamma$")
plt.ylabel(r"$\delta\Delta$")
plt.legend()

plt.show()

実行結果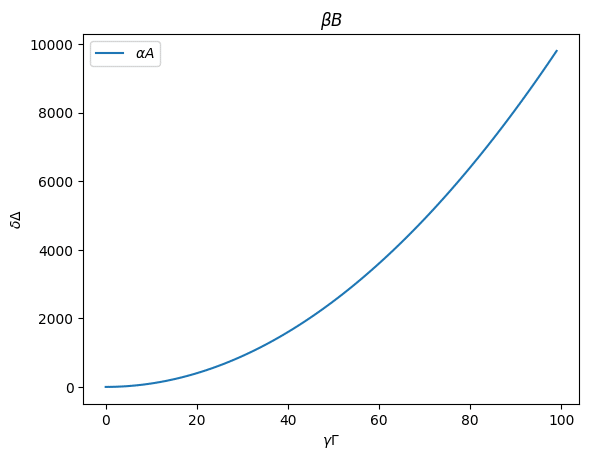
ただし「\(バックスラッシュ)」が必要のないギリシャ文字を繋げようとするとエラーが出ます。
そのためどんな時にもギリシャ文字間には半角スペースを入れておいた方が安全です。
import matplotlib.pyplot as plt

x = range(100)
y = [val**2 for val in x]

fig = plt.figure()
plt.clf()

plt.plot(x, y, label=r"$\alphaA$")

plt.title(r"$\betaB$")
plt.xlabel(r"$\gamma \Gamma$")
plt.ylabel(r"$\delta \Delta$")
plt.legend()

plt.show()

実行結果
---------------------------------------------------------------------------
ValueError                                Traceback (most recent call last)
File /Library/Frameworks/Python.framework/Versions/3.10/lib/python3.10/site-packages/IPython/core/formatters.py:340, in BaseFormatter.__call__(self, obj)
    338     pass
    339 else:
--> 340     return printer(obj)
    341 # Finally look for special method names
    342 method = get_real_method(obj, self.print_method)

(中略)

ValueError:
\betaB
^
ParseFatalException: Unknown symbol: \betaB, found '\'  (at char 0), (line:1, col:1)

<Figure size 640x480 with 1 Axes>
また「\(バックスラッシュ)」がいらないギリシャ文字に「\」をつけてしまってもエラーとなるのでご注意ください。
import matplotlib.pyplot as plt

x = range(100)
y = [val**2 for val in x]

fig = plt.figure()
plt.clf()

plt.plot(x, y, label=r"$\alpha\A$")

plt.title(r"$\beta\B$")
plt.xlabel(r"$\gamma\Gamma$")
plt.ylabel(r"$\delta\Delta$")
plt.legend()

plt.show()

実行結果
---------------------------------------------------------------------------
ValueError                                Traceback (most recent call last)
File /Library/Frameworks/Python.framework/Versions/3.10/lib/python3.10/site-packages/IPython/core/formatters.py:340, in BaseFormatter.__call__(self, obj)
    338     pass
    339 else:
--> 340     return printer(obj)
    341 # Finally look for special method names
    342 method = get_real_method(obj, self.print_method)

(中略)

ValueError:
\beta\B
     ^
ParseFatalException: Unknown symbol: \B, found '\'  (at char 5), (line:1, col:6)

<Figure size 640x480 with 1 Axes>
次回はrandomモジュール、NumPy、SciPyを使って正規分布(ガウス分布)に従うランダムな値を取得する方法を紹介します。
ではでは今回はこんな感じで。

コメント