目次
matplotlib
前回、PythonのNumPyでndarrayから複数のインデックスを指定し複数の要素を一度に取得する方法を紹介しました。
あわせて読みたい

【NumPy】ndarrayから複数のインデックスを指定し複数の要素を一度に取得する方法[Python]
NumPy 前回、PythonのOpenCVで画像に大きなノイズ(むしろ塗りつぶし)を入れる方法を紹介しました。 今回はNumPyのndarrayを使って複数のインデックスを指定し、複数の…
今回はmatplotlibでxlim、ylimを使ってグラフエリアの最大値、最小値を取得する方法を紹介します。
まずはこんな感じでランダムな数値をもつグラフを作成してみました。
import matplotlib.pyplot as plt
import numpy as np

rng = np.random.default_rng(12345)

x = range(100)
y = [rng.integers(100) for _ in x]

fig = plt.figure()
plt.clf()

plt.plot(x, y)

plt.show()

実行結果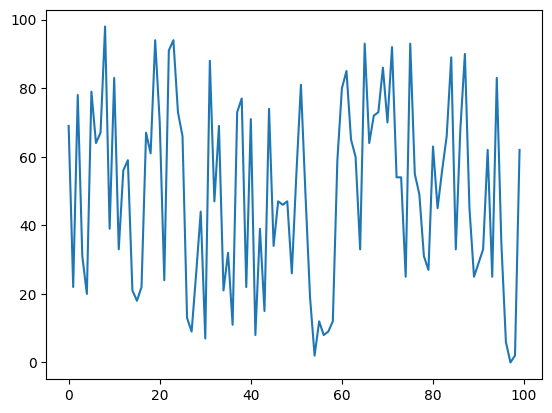
それでは始めていきましょう。
xlim、ylimのおさらい
まずはxlim、ylimのおさらいからです。
xlim、ylimはそれぞれ「plt.xlim(最小値, 最大値)」、「plt.ylim(最小値, 最大値)」とすることでグラフエリアの最小値、最大値を設定することができる関数です。
import matplotlib.pyplot as plt
import numpy as np

rng = np.random.default_rng(12345)

x = range(100)
y = [rng.integers(100) for _ in x]

fig = plt.figure()
plt.clf()

plt.plot(x, y)

plt.xlim(25, 75)
plt.ylim(25, 75)

plt.show()

実行結果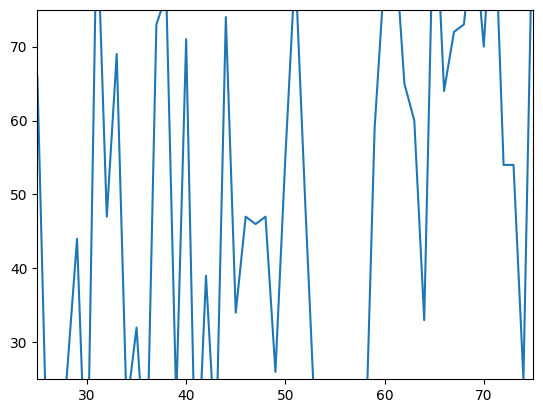
最大値、最小値の取得方法
xlim、ylimですが実は2つの返り値があり、それを取得することでグラフエリアの最小値、最大値を取得することができます。
つまり「x_min, x_max = plt.xlim()」や「y_min, y_max = plt.ylim()」とすることで、グラフエリアのX軸方向の最小値、最大値、Y軸方向の最小値、最大値を取得することができます。
import matplotlib.pyplot as plt
import numpy as np

rng = np.random.default_rng(12345)

x = range(100)
y = [rng.integers(100) for _ in x]

fig = plt.figure()
plt.clf()

plt.plot(x, y)

x_min, x_max = plt.xlim()
y_min, y_max = plt.ylim()

print(x_min, x_max)
print(y_min, y_max)

plt.show()

実行結果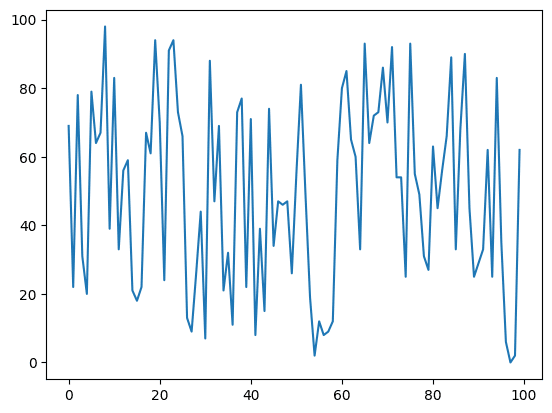
もちろんxlim、ylimに値を与えた場合でも可能です。
import matplotlib.pyplot as plt
import numpy as np

rng = np.random.default_rng(12345)

x = range(100)
y = [rng.integers(100) for _ in x]

fig = plt.figure()
plt.clf()

plt.plot(x, y)

x_min, x_max = plt.xlim(0, 100)
y_min, y_max = plt.ylim(0, 100)

print(x_min, x_max)
print(y_min, y_max)

plt.show()

実行結果
0.0 100.0
0.0 100.0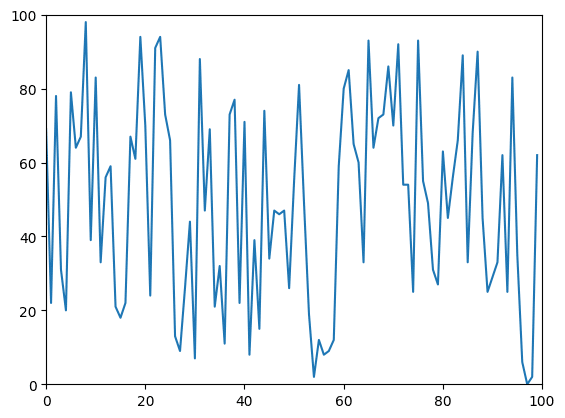
set_xlim、set_ylimの場合
2軸グラフなどで使うset_xlim、set_ylimでも同じく「ax1_xmin, ax1_xmax = ax1.set_xlim()」、「ax1_ymin, ax1_ymax = ax1.set_ylim()」とすることで、それぞれの軸の最小値、最大値を取得することができます。
import matplotlib.pyplot as plt
import numpy as np

rng = np.random.default_rng(12345)

x = range(100)
y1 = [rng.integers(100) for _ in x]
y2 = [rng.integers(10) for _ in x]

fig = plt.figure()
plt.clf()

ax1 = fig.subplots()
ax2 = ax1.twinx()

ax1.plot(x, y1, color="tab:blue")
ax2.plot(x, y2, color="tab:orange")

ax1_xmin, ax1_xmax = ax1.set_xlim()
ax1_ymin, ax1_ymax = ax1.set_ylim()

print(ax1_xmin, ax1_xmax)
print(ax1_ymin, ax1_ymax)

plt.show()

実行結果
-4.95 103.95
-4.9 102.9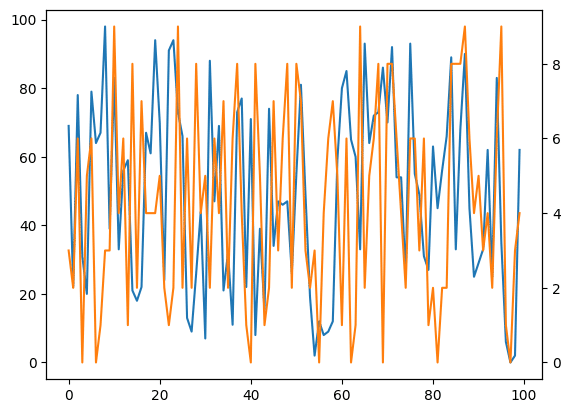
次回はSciPyとPandasを使ってグラフの歪度(左右の非対称具合)と尖度(尖り具合)を取得する方法を紹介します。
ではでは今回はこんな感じで。

コメント