matplotlib
前回、matplotlibでイベントプロット(eventplot)を描く方法を紹介しました。

今回はmatplotlibのplt.contourで等高線図を表示する方法を紹介します。
それでは始めていきましょう。
必要なデータ
まずは必要なデータを見ていきます。
必要なデータとしてはX値の2次元リスト、Y値の2次元リスト、Z値の2次元リストです。
まずX値、Y値の2次元リストですが、NumPyのmeshgridを使うと楽に作成できます。
meshgridの使い方はこちらの記事で解説していますので、良かったらどうぞ。
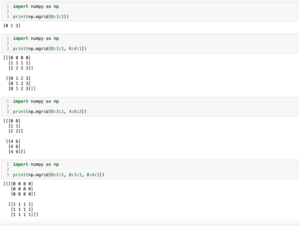
import numpy as np

x_num = 5
y_num = 7
step = 0.5

x_list = np.arange(0, x_num, step)
y_list = np.arange(0, y_num, step)
X, Y = np.meshgrid(x_list, y_list)

print(X)
print(Y)

実行結果
[[0.  0.5 1.  1.5 2.  2.5 3.  3.5 4.  4.5]
 [0.  0.5 1.  1.5 2.  2.5 3.  3.5 4.  4.5]
 [0.  0.5 1.  1.5 2.  2.5 3.  3.5 4.  4.5]
 [0.  0.5 1.  1.5 2.  2.5 3.  3.5 4.  4.5]
 [0.  0.5 1.  1.5 2.  2.5 3.  3.5 4.  4.5]
 [0.  0.5 1.  1.5 2.  2.5 3.  3.5 4.  4.5]
 [0.  0.5 1.  1.5 2.  2.5 3.  3.5 4.  4.5]
 [0.  0.5 1.  1.5 2.  2.5 3.  3.5 4.  4.5]
 [0.  0.5 1.  1.5 2.  2.5 3.  3.5 4.  4.5]
 [0.  0.5 1.  1.5 2.  2.5 3.  3.5 4.  4.5]
 [0.  0.5 1.  1.5 2.  2.5 3.  3.5 4.  4.5]
 [0.  0.5 1.  1.5 2.  2.5 3.  3.5 4.  4.5]
 [0.  0.5 1.  1.5 2.  2.5 3.  3.5 4.  4.5]
 [0.  0.5 1.  1.5 2.  2.5 3.  3.5 4.  4.5]]
[[0.  0.  0.  0.  0.  0.  0.  0.  0.  0. ]
 [0.5 0.5 0.5 0.5 0.5 0.5 0.5 0.5 0.5 0.5]
 [1.  1.  1.  1.  1.  1.  1.  1.  1.  1. ]
 [1.5 1.5 1.5 1.5 1.5 1.5 1.5 1.5 1.5 1.5]
 [2.  2.  2.  2.  2.  2.  2.  2.  2.  2. ]
 [2.5 2.5 2.5 2.5 2.5 2.5 2.5 2.5 2.5 2.5]
 [3.  3.  3.  3.  3.  3.  3.  3.  3.  3. ]
 [3.5 3.5 3.5 3.5 3.5 3.5 3.5 3.5 3.5 3.5]
 [4.  4.  4.  4.  4.  4.  4.  4.  4.  4. ]
 [4.5 4.5 4.5 4.5 4.5 4.5 4.5 4.5 4.5 4.5]
 [5.  5.  5.  5.  5.  5.  5.  5.  5.  5. ]
 [5.5 5.5 5.5 5.5 5.5 5.5 5.5 5.5 5.5 5.5]
 [6.  6.  6.  6.  6.  6.  6.  6.  6.  6. ]
 [6.5 6.5 6.5 6.5 6.5 6.5 6.5 6.5 6.5 6.5]]
この様に各点のXとYの位置をそれぞれ格納した2次元リストを作成します。
Z値の2次元リストはそれぞれのX、Yの座標における高さになるので自由に作ることができます。
今回は各点のX値とY値をかけたものをZ値とします。
等高線の表示の仕方
X値、Y値、Z値が準備できたら等高線を表示してみましょう。
表示の仕方は「plt.contour(X値のリスト, Y値のリスト, Z値のリスト)」です。
import matplotlib.pyplot as plt
import numpy as np

x_num = 5
y_num = 7
step = 0.5

x_list = np.arange(0, x_num, step)
y_list = np.arange(0, y_num, step)
X, Y = np.meshgrid(x_list, y_list)

Z = []
for y_val in y_list:
    z_list_temp = []
    for x_val in x_list:
        z_list_temp.append(x_val*y_val)
    Z.append(z_list_temp)

fig = plt.figure()
plt.clf()

plt.contour(X, Y, Z)

plt.show()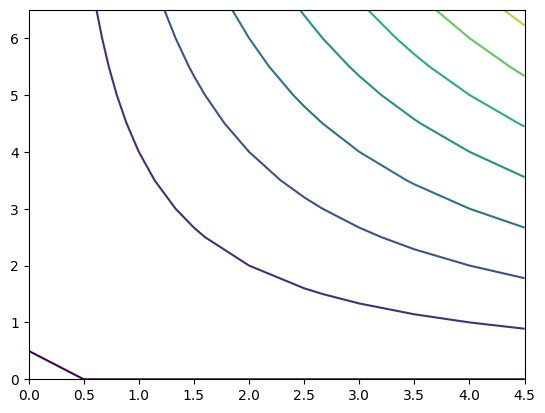
線の太さ
線の太さを変更するにはplt.contourのオプション引数に「linewidths=値」を追加します。
import matplotlib.pyplot as plt
import numpy as np

x_num = 5
y_num = 7
step = 0.5

x_list = np.arange(0, x_num, step)
y_list = np.arange(0, y_num, step)
X, Y = np.meshgrid(x_list, y_list)

Z = []
for y_val in y_list:
    z_list_temp = []
    for x_val in x_list:
        z_list_temp.append(x_val*y_val)
    Z.append(z_list_temp)

fig = plt.figure()
plt.clf()

plt.contour(X, Y, Z, linewidths=5)

plt.show()

実行結果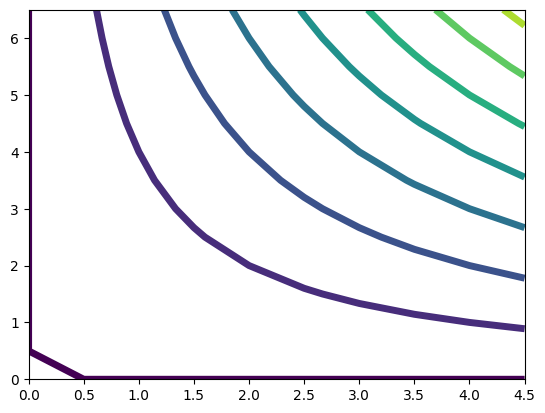
線のカラーマップの変更
線の色はカラーマップで指定していますが、変更するにはplt.contourのオプション引数に「cmap=カラーマップ」を追加します。
import matplotlib.pyplot as plt
import numpy as np

x_num = 5
y_num = 7
step = 0.5

x_list = np.arange(0, x_num, step)
y_list = np.arange(0, y_num, step)
X, Y = np.meshgrid(x_list, y_list)

Z = []
for y_val in y_list:
    z_list_temp = []
    for x_val in x_list:
        z_list_temp.append(x_val*y_val)
    Z.append(z_list_temp)

fig = plt.figure()
plt.clf()

plt.contour(X, Y, Z, cmap="rainbow")

plt.show()

実行結果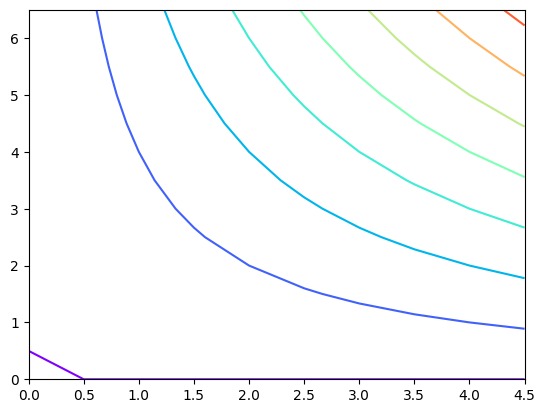
カラーバーの表示
カラーバーを表示するにはプログラム中に「plt.colorbar()」を追加します。
import matplotlib.pyplot as plt
import numpy as np

x_num = 5
y_num = 7
step = 0.5

x_list = np.arange(0, x_num, step)
y_list = np.arange(0, y_num, step)
X, Y = np.meshgrid(x_list, y_list)

Z = []
for y_val in y_list:
    z_list_temp = []
    for x_val in x_list:
        z_list_temp.append(x_val*y_val)
    Z.append(z_list_temp)

fig = plt.figure()
plt.clf()

plt.contour(X, Y, Z)

plt.colorbar()

plt.show()

実行結果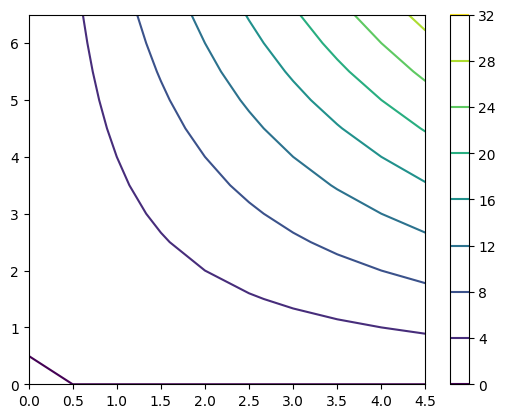
表示色の最大値、最小値の設定
等高線の表示色の最大値、最小値を設定する場合、plt.contourのオプション引数に「vmin=最小値」、「vmax=最大値」を追加します。
import matplotlib.pyplot as plt
import numpy as np

x_num = 5
y_num = 7
step = 0.5

x_list = np.arange(0, x_num, step)
y_list = np.arange(0, y_num, step)
X, Y = np.meshgrid(x_list, y_list)

Z = []
for y_val in y_list:
    z_list_temp = []
    for x_val in x_list:
        z_list_temp.append(x_val*y_val)
    Z.append(z_list_temp)

fig = plt.figure()
plt.clf()

plt.contour(X, Y, Z, vmin = 10, vmax=20)

plt.colorbar()

plt.show()

実行結果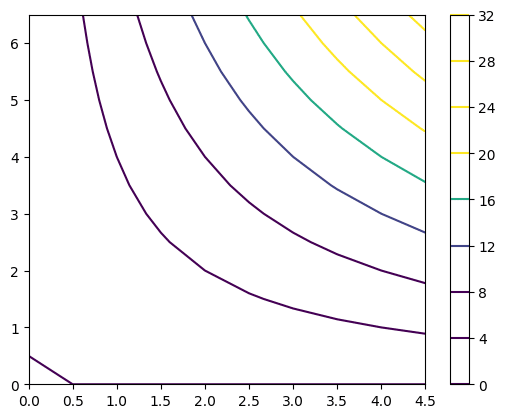
等高線の本数の制御
等高線の本数を制御するにはplt.contourのオプション引数として「levels」を追加します。
追加の方法としては数値を与えた場合はその数値の本数に分割されます。
import matplotlib.pyplot as plt
import numpy as np

x_num = 5
y_num = 7
step = 0.5

x_list = np.arange(0, x_num, step)
y_list = np.arange(0, y_num, step)
X, Y = np.meshgrid(x_list, y_list)

Z = []
for y_val in y_list:
    z_list_temp = []
    for x_val in x_list:
        z_list_temp.append(x_val*y_val)
    Z.append(z_list_temp)

fig = plt.figure()
plt.clf()

plt.contour(X, Y, Z, levels=15)

plt.colorbar()

plt.show()

実行結果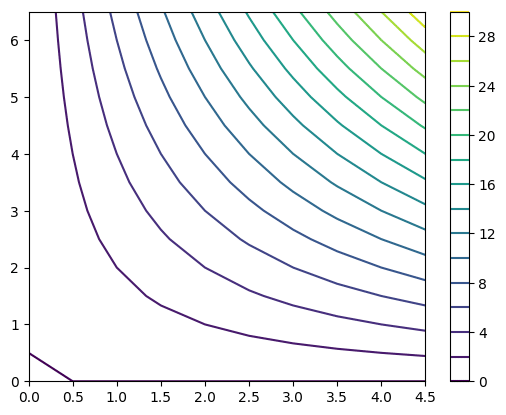
また数値のリストを与えた場合はその数値のリストの等高線が表示されます。
import matplotlib.pyplot as plt
import numpy as np

x_num = 5
y_num = 7
step = 0.5

x_list = np.arange(0, x_num, step)
y_list = np.arange(0, y_num, step)
X, Y = np.meshgrid(x_list, y_list)

Z = []
for y_val in y_list:
    z_list_temp = []
    for x_val in x_list:
        z_list_temp.append(x_val*y_val)
    Z.append(z_list_temp)

fig = plt.figure()
plt.clf()

plt.contour(X, Y, Z, levels=np.arange(0, 30, 0.5))

plt.colorbar()

plt.show()

実行結果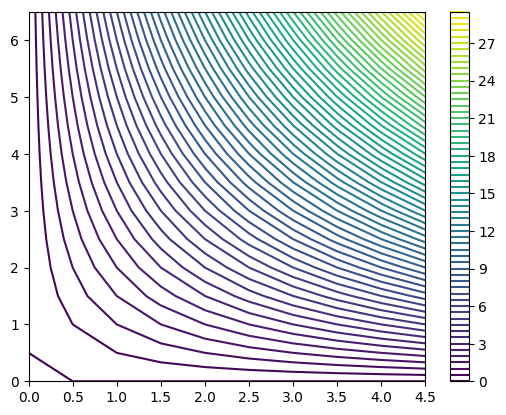
等高線上に数値を表示
等高線上に数値を表示するにはplt.contourの返り値を変数で受け、「plt.clabel(変数)」をプログラムに追加します。
import matplotlib.pyplot as plt
import numpy as np

x_num = 5
y_num = 7
step = 0.5

x_list = np.arange(0, x_num, step)
y_list = np.arange(0, y_num, step)
X, Y = np.meshgrid(x_list, y_list)

Z = []
for y_val in y_list:
    z_list_temp = []
    for x_val in x_list:
        z_list_temp.append(x_val*y_val)
    Z.append(z_list_temp)

fig = plt.figure()
plt.clf()

cs = plt.contour(X, Y, Z)

plt.clabel(cs)

plt.colorbar()

plt.show()

実行結果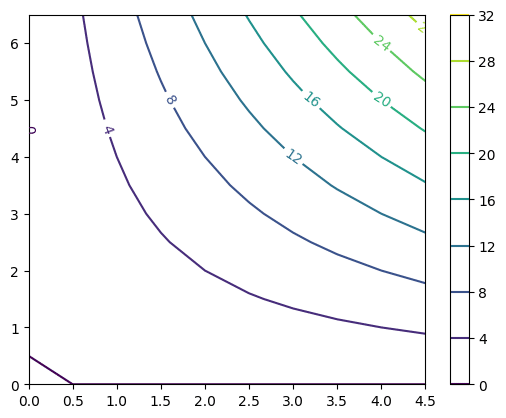
文字のサイズを大きくするにはplt.clabelのオプション引数に「fontsize=値」を追加します。
import matplotlib.pyplot as plt
import numpy as np

x_num = 5
y_num = 7
step = 0.5

x_list = np.arange(0, x_num, step)
y_list = np.arange(0, y_num, step)
X, Y = np.meshgrid(x_list, y_list)

Z = []
for y_val in y_list:
    z_list_temp = []
    for x_val in x_list:
        z_list_temp.append(x_val*y_val)
    Z.append(z_list_temp)

fig = plt.figure()
plt.clf()

cs = plt.contour(X, Y, Z)

plt.clabel(cs, fontsize=15)

plt.colorbar()

plt.show()

実行結果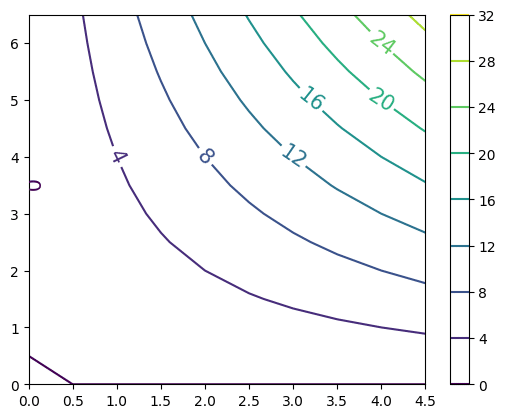
文字の色を変更するには、plt.clabelのオプション引数に「colors=色」を追加します。
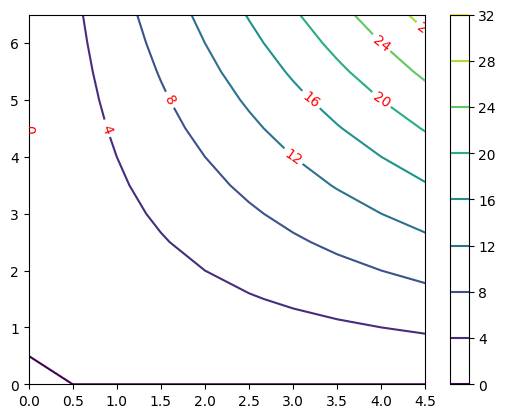
各領域を塗りつぶした投稿線を表示
各領域を塗りつぶした等高線を表示するには「plt.contour」の代わりに「plt.contourf」を用います。
import matplotlib.pyplot as plt
import numpy as np

x_num = 5
y_num = 7
step = 0.5

x_list = np.arange(0, x_num, step)
y_list = np.arange(0, y_num, step)
X, Y = np.meshgrid(x_list, y_list)

Z = []
for y_val in y_list:
    z_list_temp = []
    for x_val in x_list:
        z_list_temp.append(x_val*y_val)
    Z.append(z_list_temp)

fig = plt.figure()
plt.clf()

plt.contourf(X, Y, Z)

plt.show()

実行結果
塗りつぶしの色を変えるにはplt.contourfのオプション引数に「cmap=カラーマップ」を追加します。
import matplotlib.pyplot as plt
import numpy as np

x_num = 5
y_num = 7
step = 0.5

x_list = np.arange(0, x_num, step)
y_list = np.arange(0, y_num, step)
X, Y = np.meshgrid(x_list, y_list)

Z = []
for y_val in y_list:
    z_list_temp = []
    for x_val in x_list:
        z_list_temp.append(x_val*y_val)
    Z.append(z_list_temp)

fig = plt.figure()
plt.clf()

plt.contourf(X, Y, Z, cmap="rainbow")

plt.show()

実行結果
塗りつぶしを透明化する場合はplt.contourfのオプション引数に「alpha=値」を追加します。
値の範囲は0から1で小数点で指定します。
import matplotlib.pyplot as plt
import numpy as np

x_num = 5
y_num = 7
step = 0.5

x_list = np.arange(0, x_num, step)
y_list = np.arange(0, y_num, step)
X, Y = np.meshgrid(x_list, y_list)

Z = []
for y_val in y_list:
    z_list_temp = []
    for x_val in x_list:
        z_list_temp.append(x_val*y_val)
    Z.append(z_list_temp)

fig = plt.figure()
plt.clf()

plt.contourf(X, Y, Z, alpha=0.3)

plt.show()

実行結果
次回はNumPyで配列を繰り返し並べ、タイル状にするnp.tileを紹介します。
ではでは今回はこんな感じで。

コメント