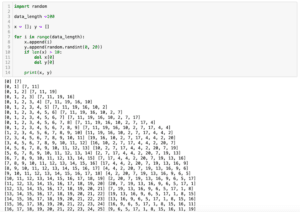
import matplotlib.pyplot as plt
import random
x = range(10)
y = [random.randint(0,50) for _ in x]
fig = plt.figure()
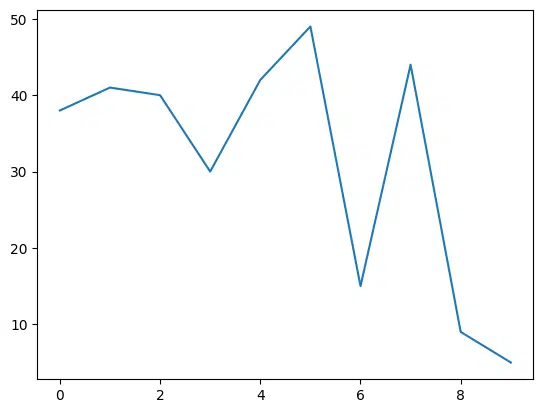
plt.plot(x, y)
plt.show()
実行結果
それでは始めていきましょう。
plt.clf()
まずは一番使うだろう「plt.clf()」を見てみましょう。
import matplotlib.pyplot as plt
import random

x = range(10)
y = [random.randint(0,50) for _ in x]

fig = plt.figure()

plt.plot(x, y)

plt.clf()

plt.show()

実行結果
<Figure size 640x480 with 0 Axes>
import matplotlib.pyplot as plt
import random

x = range(10)
y = [random.randint(0,50) for _ in x]

fig = plt.figure()

plt.show()

実行結果
<Figure size 640x480 with 0 Axes>
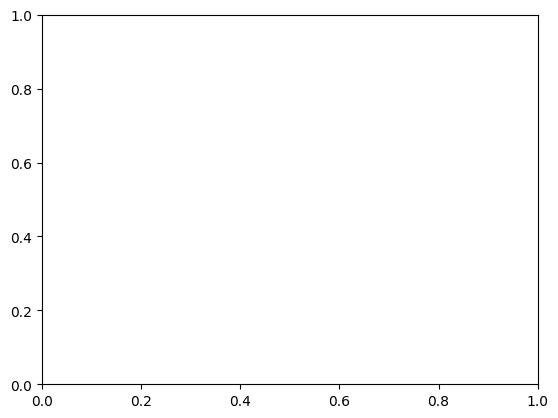
plt.cla()
次に「plt.cla()」を見てみましょう。
import matplotlib.pyplot as plt
import random

x = range(10)
y = [random.randint(0,50) for _ in x]

fig = plt.figure()

plt.plot(x, y)

plt.cla()

plt.show()

実行結果
「plt.cla()」ではグラフの軸は残り、中のデータは消去されました。
plt.close()
最後に「plt.close()」を見てみましょう。
import matplotlib.pyplot as plt
import random

x = range(10)
y = [random.randint(0,50) for _ in x]

fig = plt.figure()

plt.plot(x, y)

plt.close()

plt.show()

実行結果
コメント