matplotlib
前回、matplotlibでplt.clf()とplt.cla()、plt.close()の違いを紹介しました。
今回はmatplotlibでffmpegを使ってアニメーショングラフを作成する方法を紹介します。
それでは始めていきましょう。
ffmpegのインストール
まずはffmpegをインストールしていきます。
実はPythonのffmpegライブラリとして「ffmpeg-python」があるのですが、matplotlibでは本家のffmpegをインストールする必要があります。
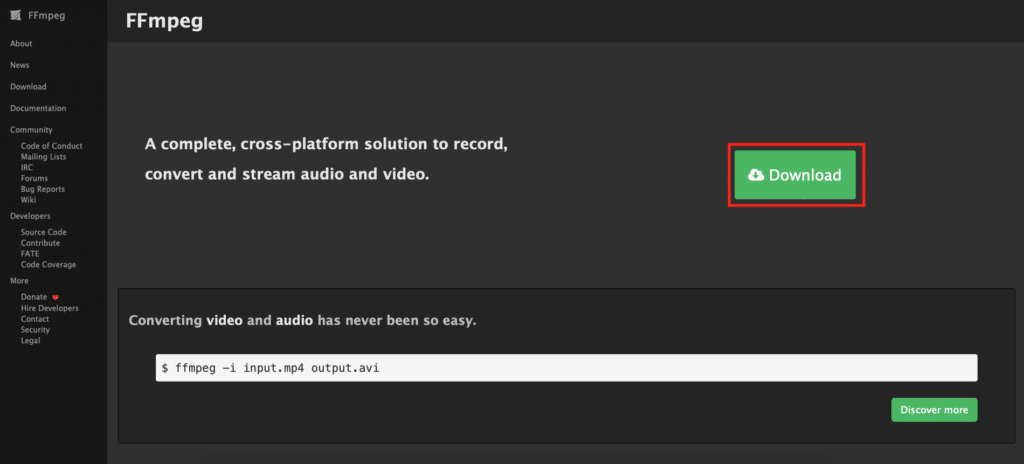
ということでffmpegのサイトにアクセスします。
「Download」をクリック。
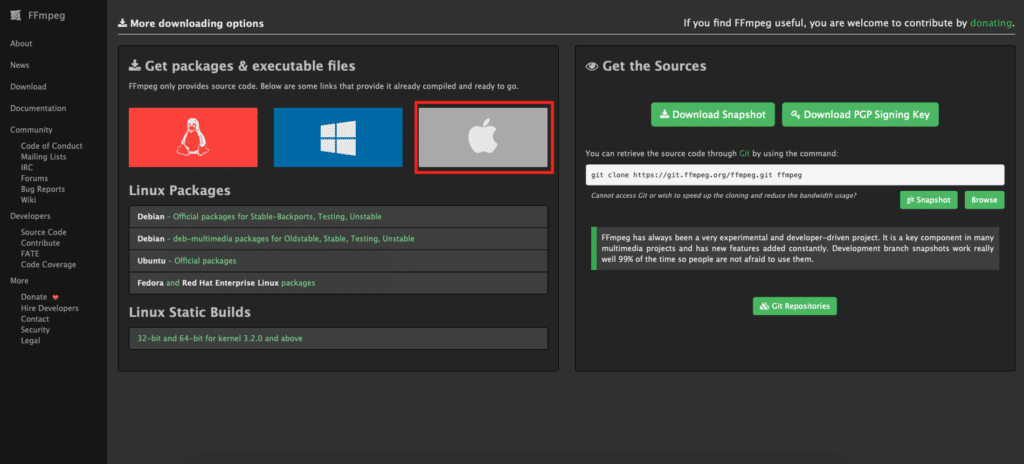
私の環境はMacなのでMacのアップルマークをクリック。
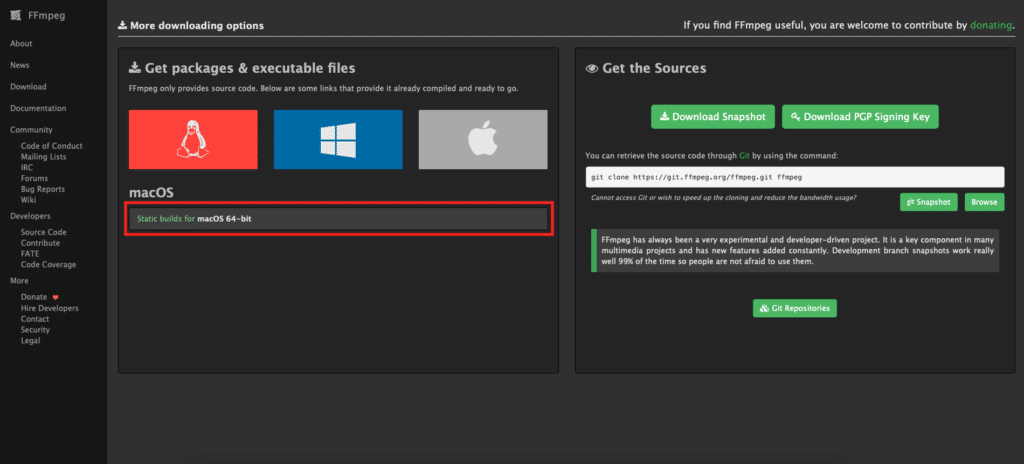
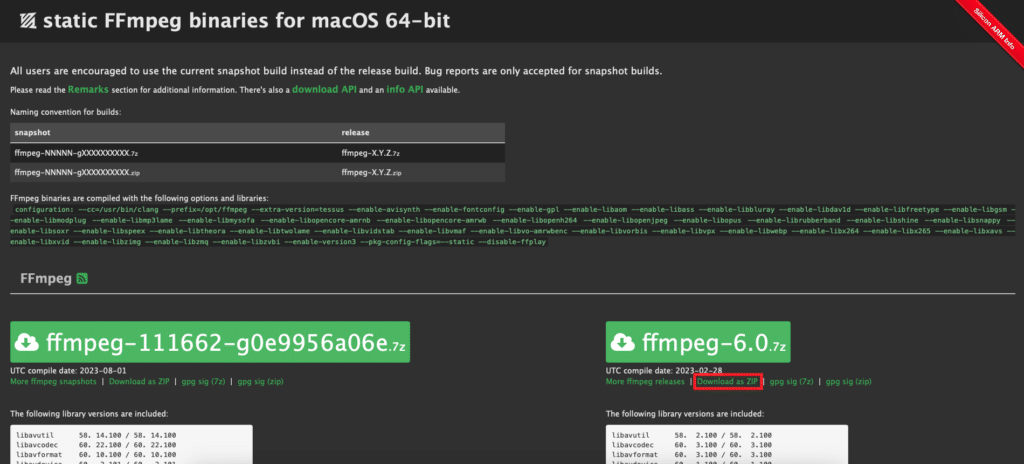
「Static builds for macOS 64-bit」をクリック。
「Download as ZIP」をクリック。
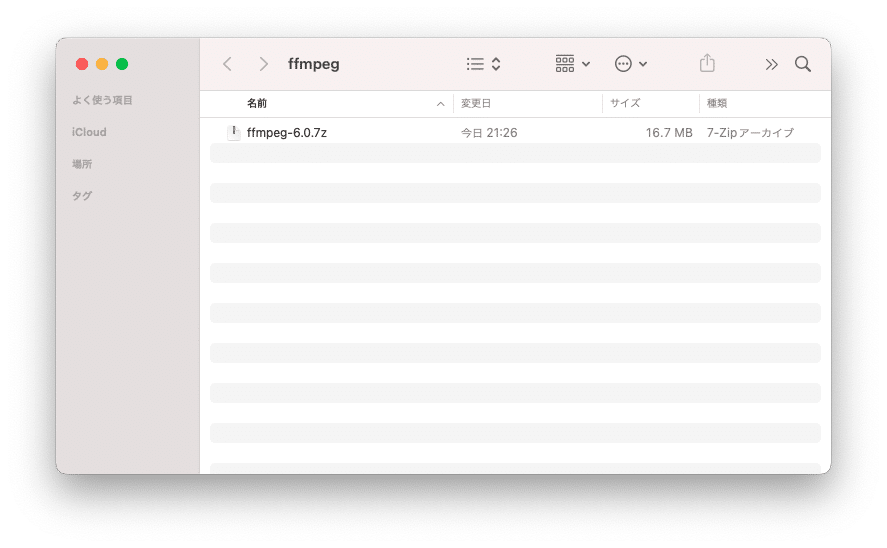
「ffmpeg-6.0.7.z」(数字はバージョンなので変わる可能性もあります)をダブルクリックして解凍します。
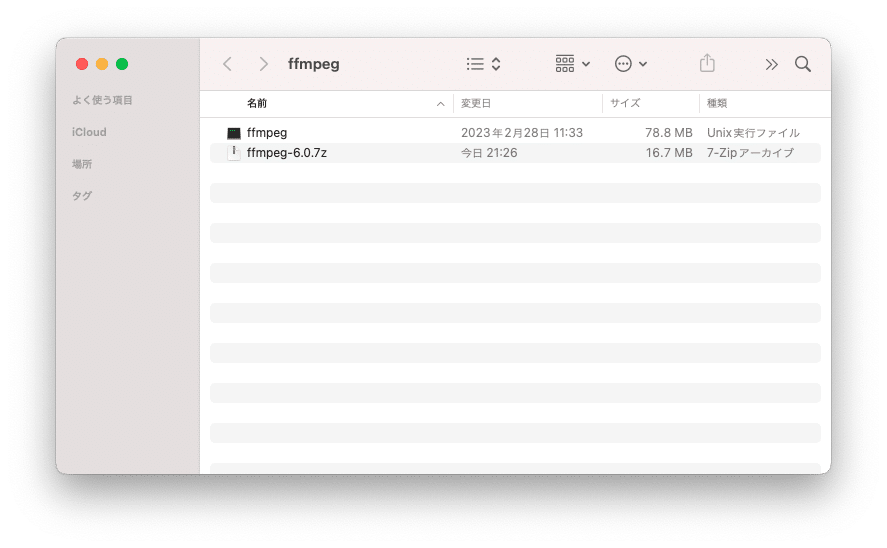
出てきた「ffmpeg」をダブルクリックします。
すると「”ffmpeg”は、開発元を検証できないため開きません。」というメッセージが出てくるので、一度キャンセルします。

画面左上のアップルマークから「システム設定」をクリックします。

「プライバシー」とセキュリティの項目に「”ffmpeg”は開発元を確認できないため、使用がブロックされました。」と表示されているので、その横にある「このまま許可」をクリックします。
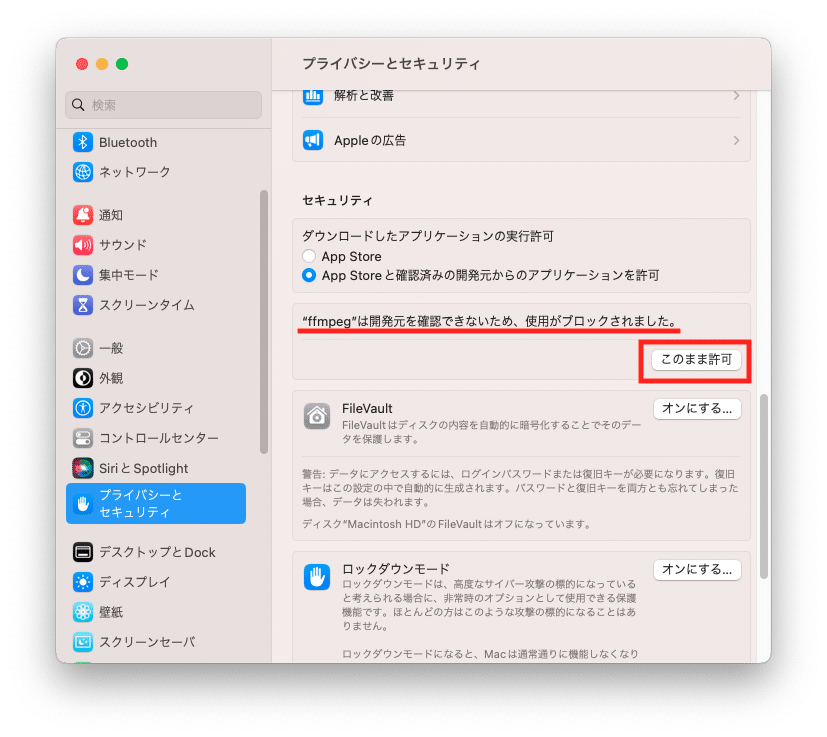
パスワード入力画面が出てくるので入力し、「設定を変更」をクリックします。

再度「ffmpeg」をダブルクリックすると「”ffmpeg”の開発元を検証できません。開いてもよろしいですか?」と表示されるので、「開く」をクリックします。

「ffmpeg」のファイルは私の場合は「/Applicaitons/ffmpeg/ffmpeg」というようにアプリケーションフォルダの中にffmpegフォルダを作成して、その中に保存しました。
保存した場所は後ほど必要なのでパスを取得しておきましょう。
matplotlibにffmpegを接続
次にmatplotlibにffmpegを接続していきます。
まず現在、ffmpegが利用できないことを確認します。
その場合、「matplotlibのanimation」をインポートし、「animation.writers.list()」で現在使用可能なアニメーション作成プログラムのリストを取得できます。
from matplotlib import animation

animation.writers.list()

実行結果
['pillow', 'html']
次にmatplotlibの設定ファイルのパスを取得します。
matplotlibをインポートし、「matplotlib.matplotlib_fname()」で取得できます。
import matplotlib

matplotlib.matplotlib_fname()

実行結果
'/Library/Frameworks/Python.framework/Versions/3.10/
lib/python3.10/site-packages/matplotlib/mpl-data/matplotlibrc'
取得したファイルパスを「vi」で開きます。
vi /Library/Frameworks/Python.framework/Versions/3.10/lib/python3.10/site-packages/matplotlib/mpl-data/matplotlibrcファイルの最後の方にある「ANIMATION」の項目を探します。
## ***************************************************************************
## * ANIMATION                                                               *
## ***************************************************************************
#animation.html: none  # How to display the animation as HTML in
                       # the IPython notebook:
                       #     - 'html5' uses HTML5 video tag
                       #     - 'jshtml' creates a JavaScript animation
#animation.writer:  ffmpeg        # MovieWriter 'backend' to use
#animation.codec:   h264          # Codec to use for writing movie
#animation.bitrate: -1            # Controls size/quality trade-off for movie.
                                  # -1 implies let utility auto-determine
#animation.frame_format: png      # Controls frame format used by temp files

## Path to ffmpeg binary.  Unqualified paths are resolved by subprocess.Popen.
#animation.ffmpeg_path:  ffmpeg
## Additional arguments to pass to ffmpeg.
#animation.ffmpeg_args:
「animation.ffmpeg_path: ffmpeg」の最初のシャープを削除し、「ffmpeg」を先ほどffmpegを保存したパスに書き換えます(私の場合は/Applicaitons/ffmpeg/ffmpeg)。
## ***************************************************************************
## * ANIMATION                                                               *
## ***************************************************************************
#animation.html: none  # How to display the animation as HTML in
                       # the IPython notebook:
                       #     - 'html5' uses HTML5 video tag
                       #     - 'jshtml' creates a JavaScript animation
#animation.writer:  ffmpeg        # MovieWriter 'backend' to use
#animation.codec:   h264          # Codec to use for writing movie
#animation.bitrate: -1            # Controls size/quality trade-off for movie.
                                  # -1 implies let utility auto-determine
#animation.frame_format: png      # Controls frame format used by temp files

## Path to ffmpeg binary.  Unqualified paths are resolved by subprocess.Popen.
animation.ffmpeg_path:  /Applications/ffmpeg/ffmpeg
## Additional arguments to pass to ffmpeg.
#animation.ffmpeg_args:
これで保存して閉じます(:wq)。
再度、使用可能なアニメーション作成プログラムを確認します。
from matplotlib import animation

animation.writers.list()

実行結果
['pillow', 'ffmpeg', 'ffmpeg_file', 'html']
アニメーショングラフを作成
それではアニメーショングラフを作成してみましょう。
作成する方法は2つ、「ArtistAnimation」と「FuncAnimation」があります。
「ArtistAnimation」ではアニメーションにするグラフを全て作成し、まとめたものを引数とします。
「FuncAnimation」ではグラフ用の関数を作成し、その関数とframesというアニメーションを作成する範囲のリストを渡し、アニメーションを作成します。
まずは「ArtistAnimation」から見てみましょう。
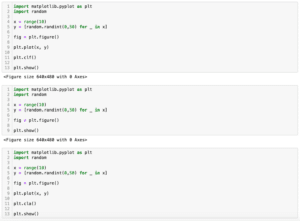
import matplotlib.pyplot as plt
import random
import time
import matplotlib.animation as animation

data_length =100

fig = plt.figure()

x = []; y = []; graph = []

line, = plt.plot(x, y)
graph.append([line])

for i in range(data_length):
    x.append(i)
    y.append(random.randint(0, 20))

    line, = plt.plot(x, y)
    graph.append([line])

ani = animation.ArtistAnimation(fig, graph)
ani.save('python-matplotlib54-1.mp4', writer='ffmpeg')
まずインポートは「import matplotlib.animation as animation」が必要になります。
そして最後の方のアニメーション作成用の関数を見てみると「animation.ArtistAnimation(fig, graph)」となっており、fig、つまりプロットエリアとgraphが引数になっています。
graphのもとを辿っていくと「line, = plt.plot(x, y)」でプロットしたグラフのうち、線の情報のみ(?)を取得し、それをリストに2次元リストとして格納しています。
最後に「ani.save(‘ファイル名.mp4′, writer=’ffmpeg’)」とするとffmpegを使ってアニメーショングラフが保存されます。
保存されたアニメーショングラフはこんな感じです。
どうやら線の色はグラフが更新されるごとに変わってしまうので、「plt.plot(x, y, color=”black”)」のようにして色を固定します。
次に「FuncAnimation」でアニメーショングラフを作成する方法です。
プログラムとしてはこんな感じ。
import matplotlib.pyplot as plt
import random
import time
import matplotlib.animation as animation

data_length = 100

x = range(data_length)
y = [random.randint(0, 20) for _ in x]

fig = plt.figure()

def graph(frame):
    plt.cla()
    x_list = x[frame:frame+10]
    y_list = y[frame:frame+10]
    plt.ylim(0,22)
    plt.plot(x_list, y_list)

ani = animation.FuncAnimation(fig, graph, frames=range(data_length-9), interval=100)
ani.save('python-matplotlib54-2.mp4', writer='ffmpeg')
最後の方の「animation.FuncAnimation(fig, graph, frames=range(data_length-9), interval=100)」でアニメーション条件を設定しています。
先ほどの「ArtistAnimation」とは異なり、framesとintervalの引数があります。
framesは各フレームのグラフを作成するための引数のリスト、intervalは各フレーム間のインターバル(ミリ秒)です。
FuncAnimationではグラフを定義する必要があり、こちらの例では「graph関数」を作成しています。
「graph関数」の引数がframesになっており、framesのリストを先頭から順にこちらの「graph関数」に入れることで1枚1枚グラフを作成して、アニメーションにするということを行っています。
先ほどのプログラムで作成したアニメーショングラフはこんな感じです。
見栄えが違ってくるので、どちらの方がわかりやすいグラフとなるのか考えて使い分けたらいいのかなと思います。
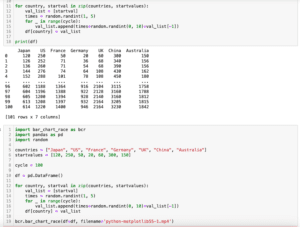
実はアニメーショングラフを作りたいなと思ったきっかけは「バーチャートレース」を作りたいと思ったからだったりします。
ということで次回はバーチャートレース(Bar Chart Race)の作成方法を紹介します。
ではではこんな感じで。
コメント