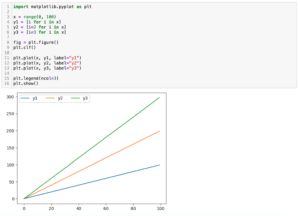
import matplotlib.pyplot as plt
x = range(0, 100)
y1 = [i for i in x]
y2 = [i*2 for i in x]
fig = plt.figure()
plt.clf()
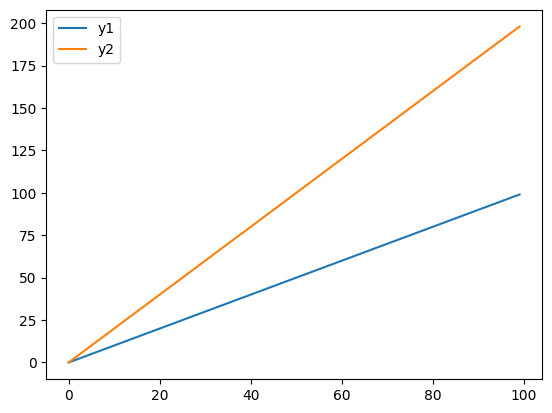
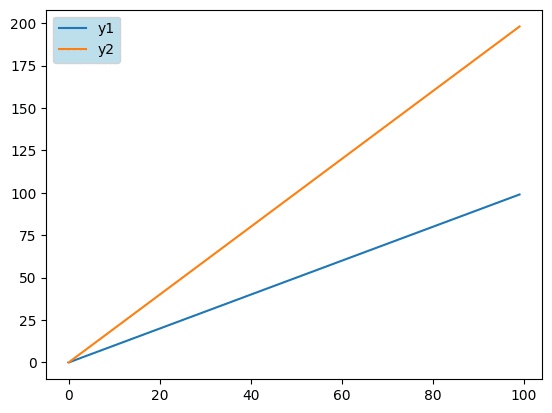
plt.plot(x, y1, label="y1")
plt.plot(x, y2, label="y2")
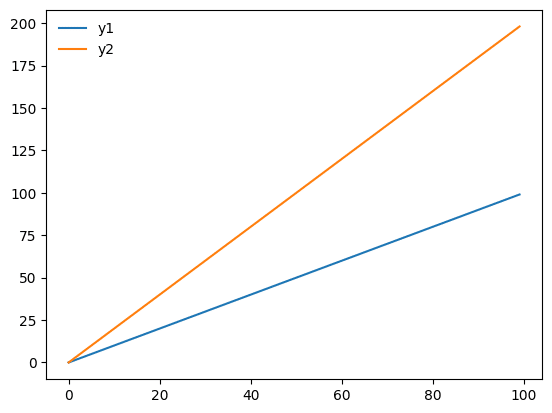
plt.legend()
plt.show()
実行結果
import matplotlib.pyplot as plt
x = range(0, 100)
y1 = [i for i in x]
y2 = [i*2 for i in x]
fig = plt.figure()
plt.clf()
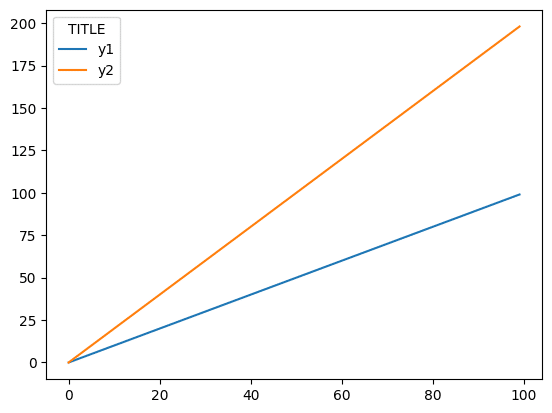
plt.plot(x, y1, label="y1")
plt.plot(x, y2, label="y2")
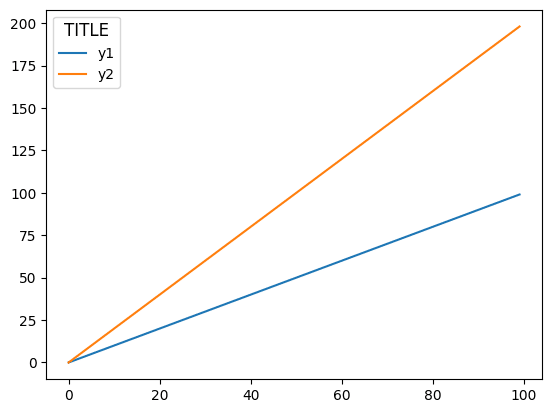
plt.legend(title="TITLE")
plt.show()
実行結果
import matplotlib.pyplot as plt
x = range(0, 100)
y1 = [i for i in x]
y2 = [i*2 for i in x]
fig = plt.figure()
plt.clf()
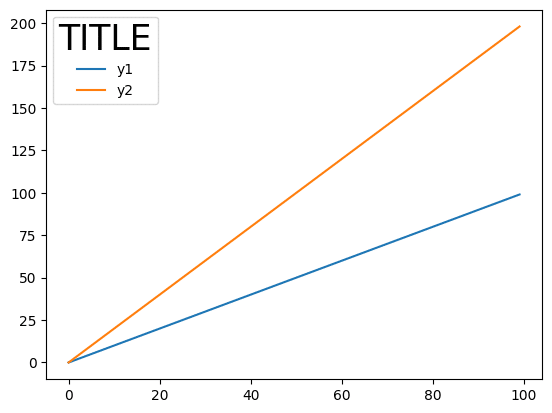
plt.plot(x, y1, label="y1")
plt.plot(x, y2, label="y2")
plt.legend(title="TITLE", title_fontsize=25)
plt.show()
実行結果
import matplotlib.pyplot as plt

x = range(0, 100)
y1 = [i for i in x]
y2 = [i*2 for i in x]

fig = plt.figure()
plt.clf()

plt.plot(x, y1, label="y1")
plt.plot(x, y2, label="y2")

plt.legend(title="TITLE", title_fontsize="large")
plt.show()

実行結果
import matplotlib.pyplot as plt

x = range(0, 100)
y1 = [i for i in x]
y2 = [i*2 for i in x]

fig = plt.figure()
plt.clf()

plt.plot(x, y1, label="y1")
plt.plot(x, y2, label="y2")

plt.legend(title="TITLE", title_fontsize="small")
plt.show()

実行結果
import matplotlib.pyplot as plt

x = range(0, 100)
y1 = [i for i in x]
y2 = [i*2 for i in x]

fig = plt.figure()
plt.clf()

plt.plot(x, y1, label="y1")
plt.plot(x, y2, label="y2")

plt.legend(frameon=False)
plt.show()

実行結果
import matplotlib.pyplot as plt
x = range(0, 100)
y1 = [i for i in x]
y2 = [i*2 for i in x]
fig = plt.figure()
plt.clf()
plt.plot(x, y1, label="y1")
plt.plot(x, y2, label="y2")
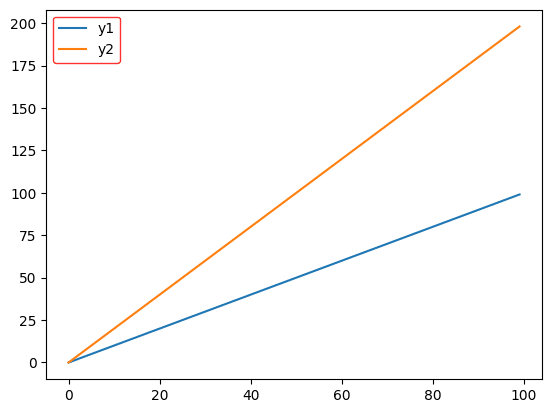
plt.legend(edgecolor="Red")
plt.show()
実行結果
凡例の枠線に影をつける方法
凡例の枠線に影をつけるには「plt.legend()」に「shadow=True」を追加します。
import matplotlib.pyplot as plt
x = range(0, 100)
y1 = [i for i in x]
y2 = [i*2 for i in x]
fig = plt.figure()
plt.clf()
plt.plot(x, y1, label="y1")
plt.plot(x, y2, label="y2")
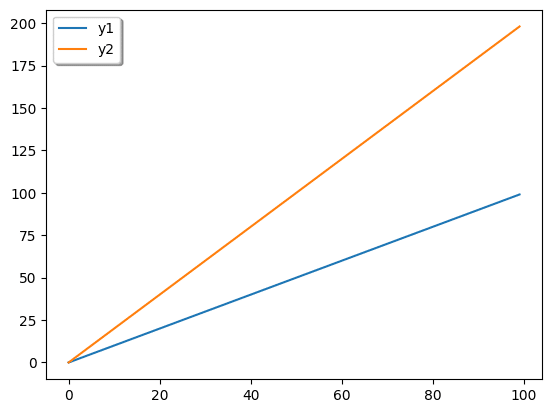
plt.legend(shadow=True)
plt.show()
実行結果
凡例の背景色を変える方法
凡例の背景色を変えるには「plt.legend()」に「facecolor=”色”」を追加します。
import matplotlib.pyplot as plt

x = range(0, 100)
y1 = [i for i in x]
y2 = [i*2 for i in x]

fig = plt.figure()
plt.clf()

plt.plot(x, y1, label="y1")
plt.plot(x, y2, label="y2")

plt.legend(facecolor="lightblue")
plt.show()

実行結果
凡例を透明化する方法
凡例を透明化するには「plt.legend()」に「framealpha=比率」を追加します。
import matplotlib.pyplot as plt

x = range(0, 100)
y1 = [i for i in x]
y2 = [i*2 for i in x]

fig = plt.figure()
plt.clf()

plt.plot(x, y1, label="y1")
plt.plot(x, y2, label="y2")

plt.legend(framealpha=0.25)
plt.show()

実行結果


コメント