matplotlib
前回、Pythonのmatplotlibで凡例のタイトルや枠線の表示・変更方法、背景色の変更方法を紹介しました。
今回は凡例をグラフエリアの外に表示する方法を紹介します
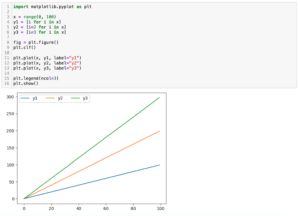
基本のグラフをこんな感じで作ってみました。
import matplotlib.pyplot as plt

x = range(0, 100)
y1 = [i for i in x]
y2 = [i*2 for i in x]
y3 = [i*3 for i in x]
y4 = [i*4 for i in x]
y5 = [i*5 for i in x]

fig = plt.figure()
plt.clf()

plt.plot(x, y1, label="data1")
plt.plot(x, y2, label="data2")
plt.plot(x, y3, label="data3")
plt.plot(x, y4, label="data4")
plt.plot(x, y5, label="data5")

plt.legend()

plt.show()

実行結果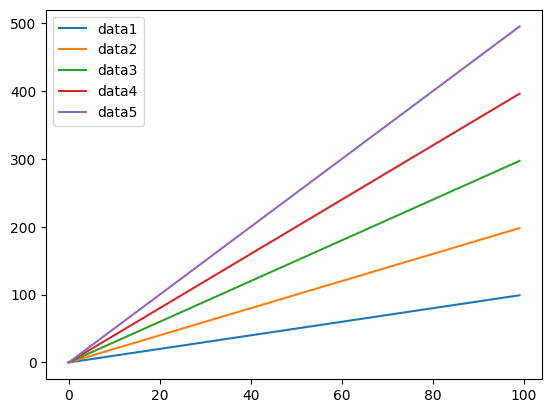
それでは始めていきましょう。
凡例をグラフエリア外の右上に表示する方法
凡例をグラフエリアの外に表示するには「plt.legend()」に「bbox_to_anchor=(X, Y))」を追加します。
この「X」、「Y」の値によって、外のどこに凡例を配置するかを決めることができます。
とりあえず「(1, 1)」として実行してみます。
import matplotlib.pyplot as plt

x = range(0, 100)
y1 = [i for i in x]
y2 = [i*2 for i in x]
y3 = [i*3 for i in x]
y4 = [i*4 for i in x]
y5 = [i*5 for i in x]

fig = plt.figure()
plt.clf()

plt.plot(x, y1, label="data1")
plt.plot(x, y2, label="data2")
plt.plot(x, y3, label="data3")
plt.plot(x, y4, label="data4")
plt.plot(x, y5, label="data5")

plt.legend(bbox_to_anchor=(1, 1))

plt.show()

実行結果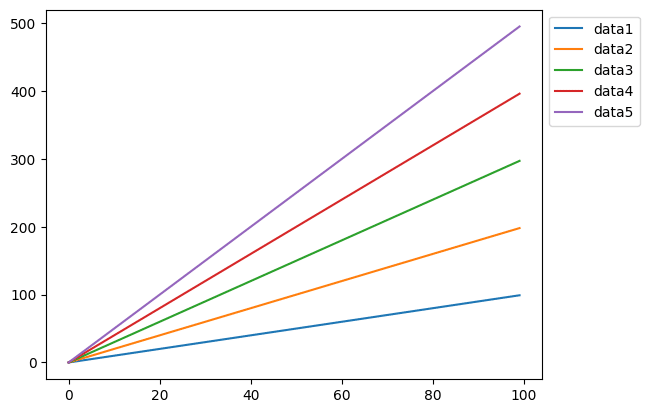
グラフエリアの外の右上に凡例が表示されました。
ちなみに「(2, 2)」にするとこうなります。
import matplotlib.pyplot as plt

x = range(0, 100)
y1 = [i for i in x]
y2 = [i*2 for i in x]
y3 = [i*3 for i in x]
y4 = [i*4 for i in x]
y5 = [i*5 for i in x]

fig = plt.figure()
plt.clf()

plt.plot(x, y1, label="data1")
plt.plot(x, y2, label="data2")
plt.plot(x, y3, label="data3")
plt.plot(x, y4, label="data4")
plt.plot(x, y5, label="data5")

plt.legend(bbox_to_anchor=(2, 2))

plt.show()

実行結果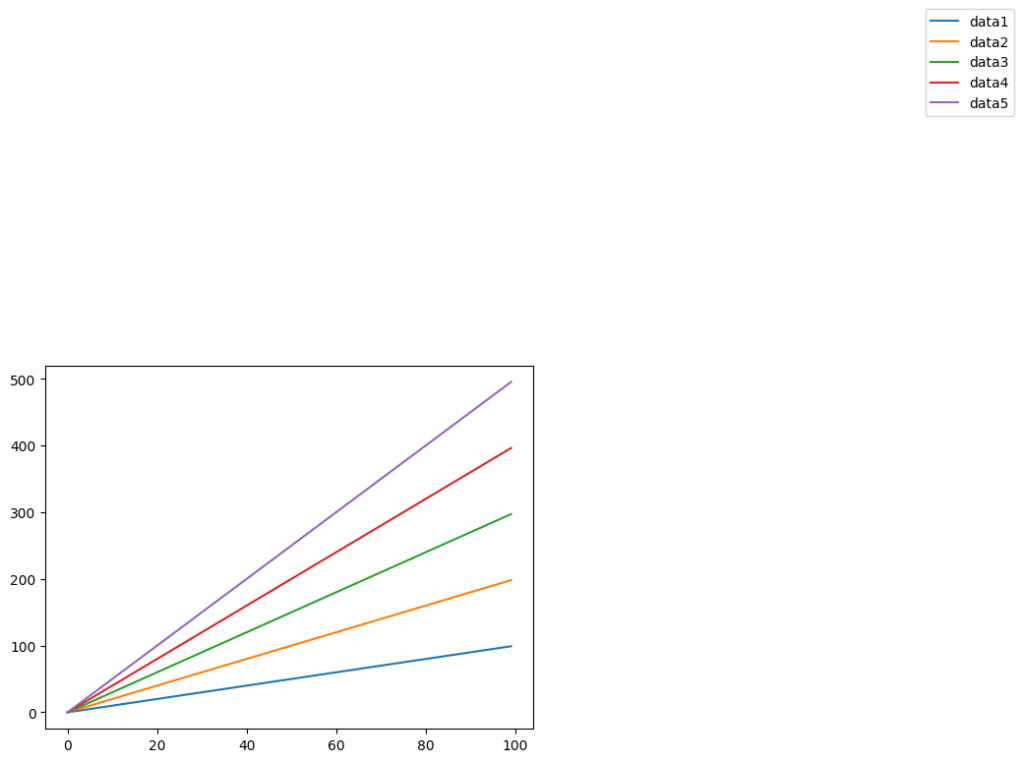
「(2, 2)」とすると右上ですが、グラフエリアから大きく離れたところに配置されてしまいました。
ということでこれ以降、X、Yの数値は大体の数値を示しているということで、お好みで見栄えが良いところになるよう調整してください。
凡例をグラフエリア外の左上に表示する方法
凡例をグラフエリア外の左上に表示するには「bbox_to_anchor=(-0.1, 1)」とします。
import matplotlib.pyplot as plt

x = range(0, 100)
y1 = [i for i in x]
y2 = [i*2 for i in x]
y3 = [i*3 for i in x]
y4 = [i*4 for i in x]
y5 = [i*5 for i in x]

fig = plt.figure()
plt.clf()

plt.plot(x, y1, label="data1")
plt.plot(x, y2, label="data2")
plt.plot(x, y3, label="data3")
plt.plot(x, y4, label="data4")
plt.plot(x, y5, label="data5")

plt.legend(bbox_to_anchor=(-0.1, 1))

plt.show()

実行結果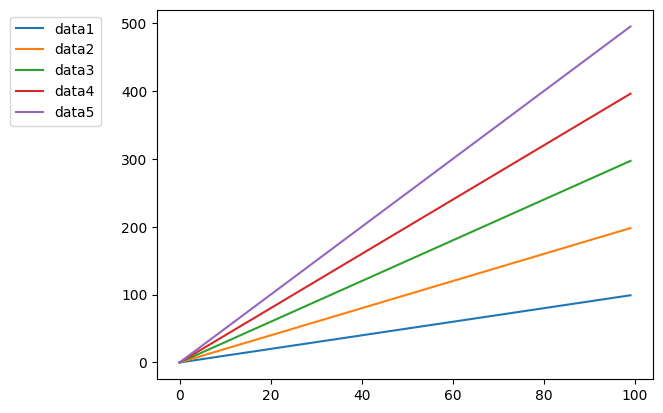
凡例をグラフエリア外の右下に表示する方法
凡例をグラフエリア外の右下に表示するには「bbox_to_anchor=(1, 0.3)」とします。
import matplotlib.pyplot as plt

x = range(0, 100)
y1 = [i for i in x]
y2 = [i*2 for i in x]
y3 = [i*3 for i in x]
y4 = [i*4 for i in x]
y5 = [i*5 for i in x]

fig = plt.figure()
plt.clf()

plt.plot(x, y1, label="data1")
plt.plot(x, y2, label="data2")
plt.plot(x, y3, label="data3")
plt.plot(x, y4, label="data4")
plt.plot(x, y5, label="data5")

plt.legend(bbox_to_anchor=(1, 0.3))

plt.show()

実行結果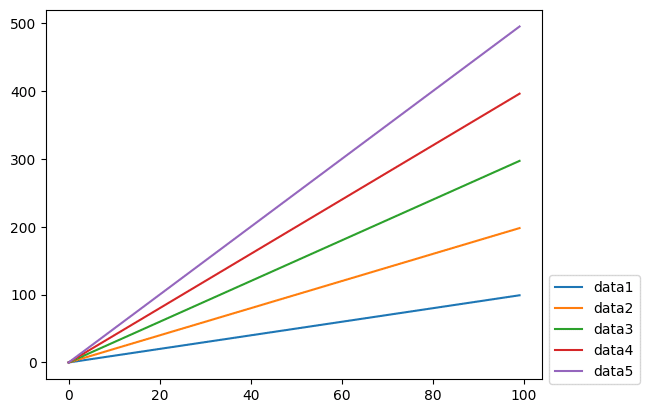
凡例をグラフエリア外の左下に表示する方法
凡例をグラフエリア外の右下に表示するには「bbox_to_anchor=(-0.1, 0.3)」とします。
import matplotlib.pyplot as plt

x = range(0, 100)
y1 = [i for i in x]
y2 = [i*2 for i in x]
y3 = [i*3 for i in x]
y4 = [i*4 for i in x]
y5 = [i*5 for i in x]

fig = plt.figure()
plt.clf()

plt.plot(x, y1, label="data1")
plt.plot(x, y2, label="data2")
plt.plot(x, y3, label="data3")
plt.plot(x, y4, label="data4")
plt.plot(x, y5, label="data5")

plt.legend(bbox_to_anchor=(-0.1, 0.3))

plt.show()

実行結果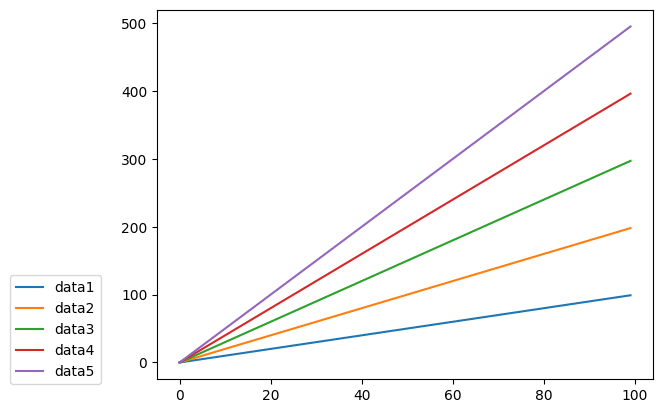
凡例をグラフエリア外の上、または下に表示する方法
凡例をグラフエリア外の上、または下に表示するには「bbox_to_anchor=(0.6, 1.4)」、「bbox_to_anchor=(0.6, -0.1)」とします。
import matplotlib.pyplot as plt

x = range(0, 100)
y1 = [i for i in x]
y2 = [i*2 for i in x]
y3 = [i*3 for i in x]
y4 = [i*4 for i in x]
y5 = [i*5 for i in x]

fig = plt.figure()
plt.clf()

plt.plot(x, y1, label="data1")
plt.plot(x, y2, label="data2")
plt.plot(x, y3, label="data3")
plt.plot(x, y4, label="data4")
plt.plot(x, y5, label="data5")

plt.legend(bbox_to_anchor=(0.6, 1.4))

plt.show()

実行結果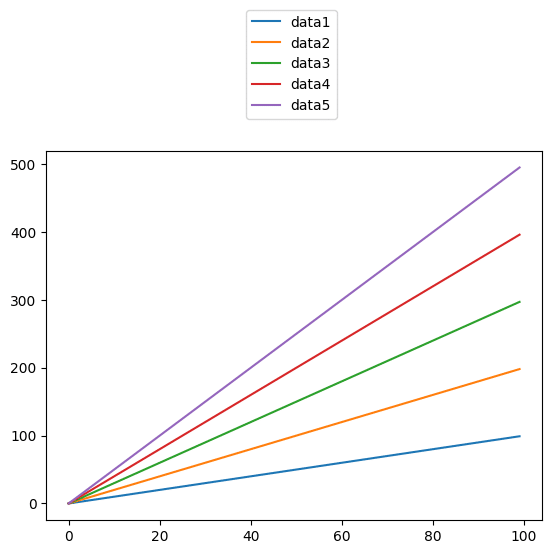
import matplotlib.pyplot as plt

x = range(0, 100)
y1 = [i for i in x]
y2 = [i*2 for i in x]
y3 = [i*3 for i in x]
y4 = [i*4 for i in x]
y5 = [i*5 for i in x]

fig = plt.figure()
plt.clf()

plt.plot(x, y1, label="data1")
plt.plot(x, y2, label="data2")
plt.plot(x, y3, label="data3")
plt.plot(x, y4, label="data4")
plt.plot(x, y5, label="data5")

plt.legend(bbox_to_anchor=(0.6, -0.1))

plt.show()

実行結果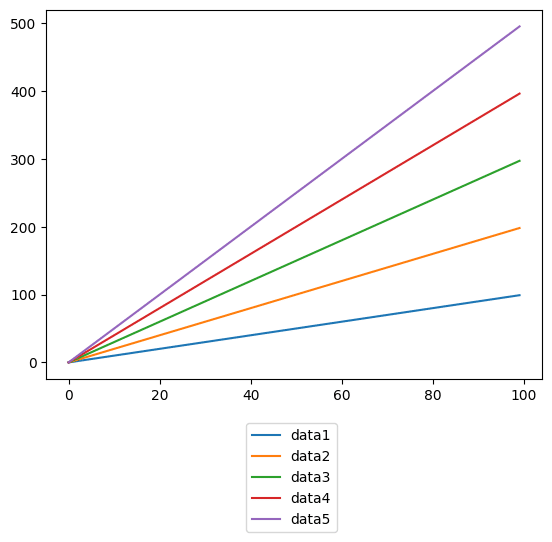
ただこのままでは不格好なので、上下に配置する場合は「ncol」のオプションを使って、凡例を横並びにすると見栄えがよくなります。
この場合、上に表示するには「bbox_to_anchor=(1.02, 1.1)」、下に表示するには「bbox_to_anchor=(1.02, -0.1)」といった感じが良さそうでした。
import matplotlib.pyplot as plt

x = range(0, 100)
y1 = [i for i in x]
y2 = [i*2 for i in x]
y3 = [i*3 for i in x]
y4 = [i*4 for i in x]
y5 = [i*5 for i in x]

fig = plt.figure()
plt.clf()

plt.plot(x, y1, label="data1")
plt.plot(x, y2, label="data2")
plt.plot(x, y3, label="data3")
plt.plot(x, y4, label="data4")
plt.plot(x, y5, label="data5")

plt.legend(bbox_to_anchor=(1.02, 1.1), ncol=5)

plt.show()

実行結果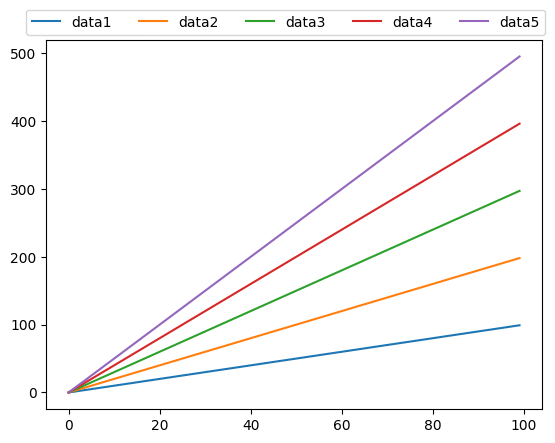
import matplotlib.pyplot as plt

x = range(0, 100)
y1 = [i for i in x]
y2 = [i*2 for i in x]
y3 = [i*3 for i in x]
y4 = [i*4 for i in x]
y5 = [i*5 for i in x]

fig = plt.figure()
plt.clf()

plt.plot(x, y1, label="data1")
plt.plot(x, y2, label="data2")
plt.plot(x, y3, label="data3")
plt.plot(x, y4, label="data4")
plt.plot(x, y5, label="data5")

plt.legend(bbox_to_anchor=(1.02, -0.1), ncol=5)

plt.show()

実行結果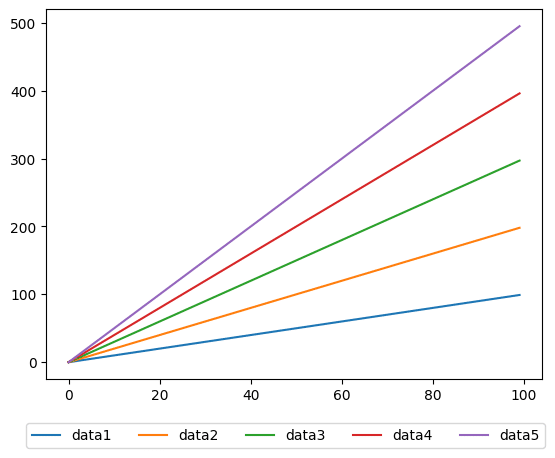
次回はリスト内の要素(文字列)を結合させるjoin関数を紹介します。
ではでは今回はこんな感じで。
コメント