X軸名、Y軸名の表示
前回、subplotを使った際のタイトルの表示方法を解説しました。
今回はsubplots、subplotで複数のグラフを表示した際のX軸名、Y軸名の追加方法を解説していきます。
まずは基本となるプログラムの紹介です。
前回、タイトルを追加したのですが、ちょっと今回の解説には邪魔になるので、削除しています、
subplotsを使った場合の基本のプログラムはこちら。
from matplotlib import pyplot as plt

x = [1, 2, 3, 4, 5, 6, 7, 8, 9, 10]
y1 = [2, 4, 6, 8, 10, 12, 14, 16, 18, 20]
y2 = [2, 4, 8, 16, 32, 64, 128, 256, 512, 1024]
y3 = [1, 3, 5, 7, 9, 11, 13, 15, 17, 19]
y4 = [2, 3, 5, 7, 11, 13, 17, 19, 23, 29]

fig = plt.figure()
axes= fig.subplots(2)

axes[0].plot(x, y1)
axes[0].plot(x, y2)
axes[1].plot(x, y3)
axes[1].plot(x, y4)

plt.subplots_adjust(hspace=0.5)

plt.show()

実行結果
こちらはsubplotの場合の基本プログラムです。
from matplotlib import pyplot as plt

x = [1, 2, 3, 4, 5, 6, 7, 8, 9, 10]
y1 = [2, 4, 6, 8, 10, 12, 14, 16, 18, 20]
y2 = [2, 4, 8, 16, 32, 64, 128, 256, 512, 1024]
y3 = [1, 3, 5, 7, 9, 11, 13, 15, 17, 19]
y4 = [2, 3, 5, 7, 11, 13, 17, 19, 23, 29]

fig = plt.figure()

plt.subplot(2,1,1)
plt.plot(x, y1)
plt.plot(x, y2)

plt.subplot(2,1,2)
plt.plot(x, y3)
plt.plot(x, y4)

plt.subplots_adjust(hspace=0.5)

plt.show()

実行結果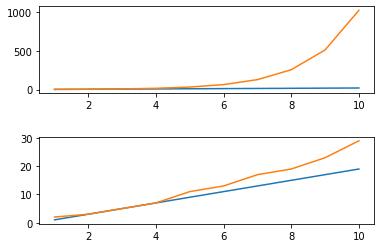
subplots_adjustでそれぞれのグラフの隙間を少し開けて、軸名を追加した際に被らないようにしています。
subplotsを使った場合の軸名の表示
subplotsを使った場合、X軸名を表示するには「set_xlabel(“X軸名”)」、Y軸名を表示するには「set_ylabel(“Y軸名”)」を追加します。
from matplotlib import pyplot as plt

x = [1, 2, 3, 4, 5, 6, 7, 8, 9, 10]
y1 = [2, 4, 6, 8, 10, 12, 14, 16, 18, 20]
y2 = [2, 4, 8, 16, 32, 64, 128, 256, 512, 1024]
y3 = [1, 3, 5, 7, 9, 11, 13, 15, 17, 19]
y4 = [2, 3, 5, 7, 11, 13, 17, 19, 23, 29]

fig = plt.figure()
axes= fig.subplots(2)

axes[0].plot(x, y1)
axes[0].plot(x, y2)
axes[1].plot(x, y3)
axes[1].plot(x, y4)

axes[0].set_xlabel("X1")
axes[1].set_xlabel("X2")

axes[0].set_ylabel("Y1")
axes[1].set_ylabel("Y2")

plt.subplots_adjust(hspace=0.5)

plt.show()

実行結果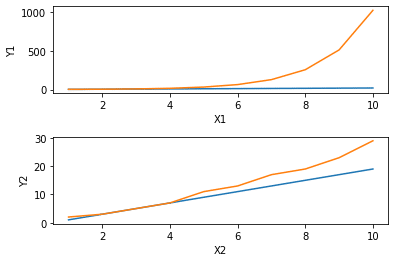
それぞれのグラフにX軸名、Y軸名を追加できました。
subplotを使った場合の軸名の表示
次にsubplotを使った場合のX軸名、Y軸名の表示の方法を見てみましょう。
X軸名を追加するには「xlabel(“X軸名”)」、Y軸名を追加するには「ylabel(“Y軸名”)」でできますが、タイトルを追加した時同様、追加する場所が重要です。
from matplotlib import pyplot as plt

x = [1, 2, 3, 4, 5, 6, 7, 8, 9, 10]
y1 = [2, 4, 6, 8, 10, 12, 14, 16, 18, 20]
y2 = [2, 4, 8, 16, 32, 64, 128, 256, 512, 1024]
y3 = [1, 3, 5, 7, 9, 11, 13, 15, 17, 19]
y4 = [2, 3, 5, 7, 11, 13, 17, 19, 23, 29]

fig = plt.figure()

plt.subplot(2,1,1)
plt.plot(x, y1)
plt.plot(x, y2)
plt.xlabel("X1")
plt.ylabel("Y1")

plt.subplot(2,1,2)
plt.plot(x, y3)
plt.plot(x, y4)
plt.xlabel("X2")
plt.ylabel("Y2")

plt.subplots_adjust(hspace=0.5)

plt.show()

実行結果
全てのグラフ共通のX軸名、Y軸名を表示する方法
ここまで表示しているそれぞれのグラフにX軸名、Y軸名を追加する方法を解説してきました。
しかしここで一つ疑問なのが、全てのグラフに共通のX軸名、Y軸名を追加できないかということ。
もし共通の軸名を表示できれば、グラフ全体がすっきりする場合もあるでしょう。
ということでその方法を紹介しますが、また細かい解説に関しては別の機会を設けますので、暫しお待ちください。
X軸で共通の軸名を追加するには、とりあえずこのコマンドで可能です。
fig.text(0.5, 0, 'x common label', ha='center', va='center', fontsize=20)Y軸の場合はこんな感じです。
fig.text(0, 0.5, 'y comonn label', ha='center', va='center', rotation='vertical', fontsize=20)このコマンドはsubplotsでもsubplotでも使うことができます。
それぞれ試してみましょう。
subplotsの場合はこんな感じ。
from matplotlib import pyplot as plt

x = [1, 2, 3, 4, 5, 6, 7, 8, 9, 10]
y1 = [2, 4, 6, 8, 10, 12, 14, 16, 18, 20]
y2 = [2, 4, 8, 16, 32, 64, 128, 256, 512, 1024]
y3 = [1, 3, 5, 7, 9, 11, 13, 15, 17, 19]
y4 = [2, 3, 5, 7, 11, 13, 17, 19, 23, 29]

fig = plt.figure()
axes= fig.subplots(2)

axes[0].plot(x, y1)
axes[0].plot(x, y2)
axes[1].plot(x, y3)
axes[1].plot(x, y4)

plt.subplots_adjust(hspace=0.5)

fig.text(0.5, 0, 'x common label', ha='center', va='center', fontsize=20)
fig.text(0, 0.5, 'y comonn label', ha='center', va='center', rotation='vertical', fontsize=20)

plt.show()

実行結果
subplotの場合はこんな感じです。
from matplotlib import pyplot as plt

x = [1, 2, 3, 4, 5, 6, 7, 8, 9, 10]
y1 = [2, 4, 6, 8, 10, 12, 14, 16, 18, 20]
y2 = [2, 4, 8, 16, 32, 64, 128, 256, 512, 1024]
y3 = [1, 3, 5, 7, 9, 11, 13, 15, 17, 19]
y4 = [2, 3, 5, 7, 11, 13, 17, 19, 23, 29]

fig = plt.figure()

plt.subplot(2,1,1)
plt.plot(x, y1)
plt.plot(x, y2)

plt.subplot(2,1,2)
plt.plot(x, y3)
plt.plot(x, y4)

plt.subplots_adjust(hspace=0.5)

fig.text(0.5, 0, 'x common label', ha='center', va='center', fontsize=20)
fig.text(0, 0.5, 'y comonn label', ha='center', va='center', rotation='vertical', fontsize=20)

plt.show()

実行結果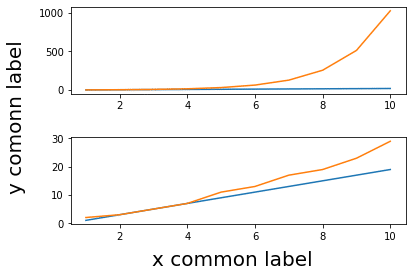
これでsubplots、subplotのどちらでも共通の軸名を表示することができました。
ここ数回で複数のグラフを表示するsubplots、subplotの使い方を解説してきて、グラフの作成方法、表示範囲の指定方法、タイトルの表示方法、軸名の表示方法を解説しました。
となるとまだ解説していないのが、凡例の表示方法ですので、次回は凡例の表示方法を解説したいと思います。
ということで今回はこんな感じで。
コメント