subplots、subplotでの凡例表示
前回はsubplots、subplotを使って複数のグラフを一括表示した時のX軸名、Y軸名の表示方法を解説しました。
今回はsubplots、subplotの両方で凡例を表示してみたいと思います。
まずは基本となるプログラムです。
こちらはsubplotsを使った際の基本となるプログラム。
from matplotlib import pyplot as plt
x = [1, 2, 3, 4, 5, 6, 7, 8, 9, 10]
y1 = [2, 4, 6, 8, 10, 12, 14, 16, 18, 20]
y2 = [2, 4, 8, 16, 32, 64, 128, 256, 512, 1024]
y3 = [1, 3, 5, 7, 9, 11, 13, 15, 17, 19]
y4 = [2, 3, 5, 7, 11, 13, 17, 19, 23, 29]
fig = plt.figure()
axes= fig.subplots(2)
axes[0].plot(x, y1)
axes[0].plot(x, y2)
axes[1].plot(x, y3)
axes[1].plot(x, y4)
plt.show()
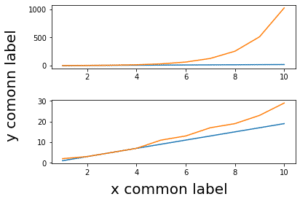
実行結果
こちらはsubplotを使った際の基本プログラム。
from matplotlib import pyplot as plt

x = [1, 2, 3, 4, 5, 6, 7, 8, 9, 10]
y1 = [2, 4, 6, 8, 10, 12, 14, 16, 18, 20]
y2 = [2, 4, 8, 16, 32, 64, 128, 256, 512, 1024]
y3 = [1, 3, 5, 7, 9, 11, 13, 15, 17, 19]
y4 = [2, 3, 5, 7, 11, 13, 17, 19, 23, 29]

fig = plt.figure()

plt.subplot(2,1,1)
plt.plot(x, y1)
plt.plot(x, y2)

plt.subplot(2,1,2)
plt.plot(x, y3)
plt.plot(x, y4)

plt.show()

実行結果
subplotsを使った場合の凡例の表示方法
ではまずはsubplotsを使った場合の凡例の表示方法を解説していきます。
凡例を表示するにはそれぞれのプロットしているデータに凡例名を付けてあげる必要があります。
それぞれのグラフをプロットしている行はここです。
axes[0].plot(x, y1)
axes[0].plot(x, y2)
axes[1].plot(x, y3)
axes[1].plot(x, y4)
ここにlabel=”データ名”を追加します。
つまりこういう感じ。
axes[0].plot(x, y1, label="y1")
axes[0].plot(x, y2, label="y2")
axes[1].plot(x, y3, label="y3")
axes[1].plot(x, y4, label="y4")
ここではそれぞれのデータに名前を付けただけになります。
ということで凡例(英語ではlegend:レジェンド)を表示するコマンドを追加する必要があります。
それが「legend」というコマンドになります。
追加すると全体のプログラムはこんな感じ。
from matplotlib import pyplot as plt

x = [1, 2, 3, 4, 5, 6, 7, 8, 9, 10]
y1 = [2, 4, 6, 8, 10, 12, 14, 16, 18, 20]
y2 = [2, 4, 8, 16, 32, 64, 128, 256, 512, 1024]
y3 = [1, 3, 5, 7, 9, 11, 13, 15, 17, 19]
y4 = [2, 3, 5, 7, 11, 13, 17, 19, 23, 29]

fig = plt.figure()
axes= fig.subplots(2)

axes[0].plot(x, y1, label="y1")
axes[0].plot(x, y2, label="y2")
axes[1].plot(x, y3, label="y3")
axes[1].plot(x, y4, label="y4")

axes[0].legend()
axes[1].legend(fontsize=15)

plt.show()

実行結果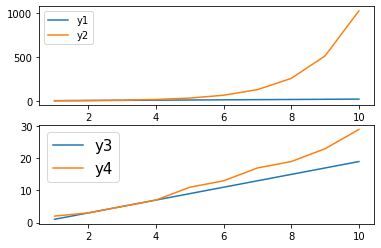
凡例を追加するだけであれば、「axes[0].legend()」のように括弧の中には何も書かなくても大丈夫です。
もしフォントサイズを変えたい場合は、「axes[1].legend(fontsize=15)」のようにfontsize=Xを括弧の中に書き込みます。
ちなみに凡例を全てのグラフに必ず表示しなければいけないわけではなく、表示したいグラフに対してだけ「lengen()」を追加します。
例えばaxes[0].legend()を削除してみます。
from matplotlib import pyplot as plt

x = [1, 2, 3, 4, 5, 6, 7, 8, 9, 10]
y1 = [2, 4, 6, 8, 10, 12, 14, 16, 18, 20]
y2 = [2, 4, 8, 16, 32, 64, 128, 256, 512, 1024]
y3 = [1, 3, 5, 7, 9, 11, 13, 15, 17, 19]
y4 = [2, 3, 5, 7, 11, 13, 17, 19, 23, 29]

fig = plt.figure()
axes= fig.subplots(2)

axes[0].plot(x, y1, label="y1")
axes[0].plot(x, y2, label="y2")
axes[1].plot(x, y3, label="y3")
axes[1].plot(x, y4, label="y4")

axes[1].legend(fontsize=15)

plt.show()

実行結果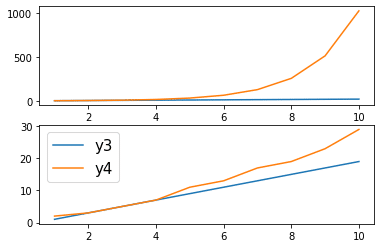
上のグラフの凡例が消え、下のグラフの凡例だけ残りました。
subplotを使った場合の凡例の表示方法
次にsubplotを使った場合の凡例の表示方法を解説していきます。
こちらの場合もデータ名をつけてあげる必要があり、label=”データ名”をplotの中に追加してやることで名前をつけることができます。
つまりここの部分に追加します。
plt.subplot(2,1,1)
plt.plot(x, y1)
plt.plot(x, y2)

plt.subplot(2,1,2)
plt.plot(x, y3)
plt.plot(x, y4)
追加するとこうなります。
plt.subplot(2,1,1)
plt.plot(x, y1, label="y1")
plt.plot(x, y2, label="y2")

plt.subplot(2,1,2)
plt.plot(x, y3, label="y3")
plt.plot(x, y4, label="y4")
こちらの場合もこれではデータ名を追加しただけなので、凡例を表示するコマンド「legend()」を追加します。
前のタイトルや軸名などと同じように、凡例表示のコマンドも書き込む場所が重要です。
ということでプログラム全体としてはこうなります。
from matplotlib import pyplot as plt

x = [1, 2, 3, 4, 5, 6, 7, 8, 9, 10]
y1 = [2, 4, 6, 8, 10, 12, 14, 16, 18, 20]
y2 = [2, 4, 8, 16, 32, 64, 128, 256, 512, 1024]
y3 = [1, 3, 5, 7, 9, 11, 13, 15, 17, 19]
y4 = [2, 3, 5, 7, 11, 13, 17, 19, 23, 29]

fig = plt.figure()

plt.subplot(2,1,1)
plt.plot(x, y1, label="y1")
plt.plot(x, y2, label="y2")
plt.legend()

plt.subplot(2,1,2)
plt.plot(x, y3, label="y3")
plt.plot(x, y4, label="y4")
plt.legend(fontsize=15)

plt.show()

実行結果
subplotの場合もsuplotsと同様にfontsize=Xを括弧の中に追加することでフォントサイズを変更することができます。
こちらも凡例を表示するグラフは選択できます。
今回はy3、y4のグラフの凡例を削除してみます。
from matplotlib import pyplot as plt

x = [1, 2, 3, 4, 5, 6, 7, 8, 9, 10]
y1 = [2, 4, 6, 8, 10, 12, 14, 16, 18, 20]
y2 = [2, 4, 8, 16, 32, 64, 128, 256, 512, 1024]
y3 = [1, 3, 5, 7, 9, 11, 13, 15, 17, 19]
y4 = [2, 3, 5, 7, 11, 13, 17, 19, 23, 29]

fig = plt.figure()

plt.subplot(2,1,1)
plt.plot(x, y1, label="y1")
plt.plot(x, y2, label="y2")
plt.legend()

plt.subplot(2,1,2)
plt.plot(x, y3, label="y3")
plt.plot(x, y4, label="y4")

plt.show()

実行結果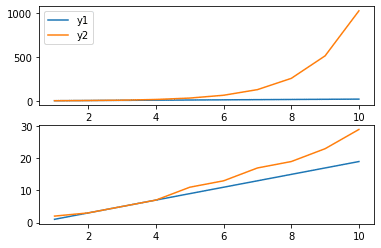
上のグラフだけ凡例が表示され、下のグラフには凡例は表示されなくなりました。
今回はsubplots、subplotを使い、複数のグラフを一括表示した際の凡例の表示方法を解説しました。
次回は「複数のグラフを一括表示した時のグラフの位置やサイズの調整方法」を解説したいと思います。
ではでは今回はこんな感じで。
コメント