グラフ一括表示の際のタイトルの表示
前回、subplots、subplotでのX軸、Y軸の表示範囲を指定する方法を解説しました。
今回はsubplots、そしてsubplotでグラフを一括表示した際にタイトルを表示する方法を解説していきます。
subplots:グラフ全体のタイトルを表示
まずはsubplotsを使った際のタイトルの表示方法を見ていきましょう。
基本となるプログラムはこちらです。
from matplotlib import pyplot as plt
x = [1, 2, 3, 4, 5, 6, 7, 8, 9, 10]
y1 = [2, 4, 6, 8, 10, 12, 14, 16, 18, 20]
y2 = [2, 4, 8, 16, 32, 64, 128, 256, 512, 1024]
y3 = [1, 3, 5, 7, 9, 11, 13, 15, 17, 19]
y4 = [2, 3, 5, 7, 11, 13, 17, 19, 23, 29]
fig = plt.figure()
axes= fig.subplots(2)
axes[0].plot(x, y1)
axes[0].plot(x, y2)
axes[1].plot(x, y3)
axes[1].plot(x, y4)
plt.show()
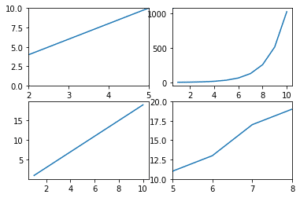
実行結果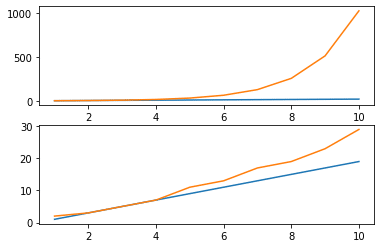
データはX値が一つ、Y値がy1からy4までの4つで、値自体は前回と同じです。
ただグラフを表示する数は2つにして、一つ目のグラフにy1、y2を、二つ目のグラフにy3、y4をプロットしています。
このグラフを基本として、タイトルを表示していきましょう。
複数のグラフを一括表示するということは、タイトルとしては全体のタイトルとそれぞれのグラフのタイトルの2種類があります。
まずはグラフ全体のタイトルを付けてみましょう。
その場合には「suptitle(“タイトル”)」 を用います。
from matplotlib import pyplot as plt

x = [1, 2, 3, 4, 5, 6, 7, 8, 9, 10]
y1 = [2, 4, 6, 8, 10, 12, 14, 16, 18, 20]
y2 = [2, 4, 8, 16, 32, 64, 128, 256, 512, 1024]
y3 = [1, 3, 5, 7, 9, 11, 13, 15, 17, 19]
y4 = [2, 3, 5, 7, 11, 13, 17, 19, 23, 29]

fig = plt.figure()
axes= fig.subplots(2)

axes[0].plot(x, y1)
axes[0].plot(x, y2)
axes[1].plot(x, y3)
axes[1].plot(x, y4)

plt.suptitle("Title")

plt.show()

実行結果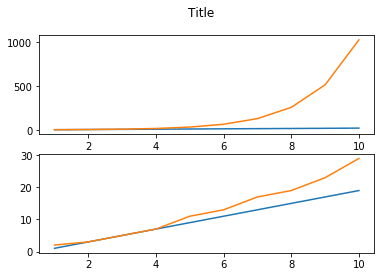
上の方に「Title」と表示されました。
ちなみにフォントサイズを変更したい場合は「fontsize=X」を追加することで可能です。
from matplotlib import pyplot as plt

x = [1, 2, 3, 4, 5, 6, 7, 8, 9, 10]
y1 = [2, 4, 6, 8, 10, 12, 14, 16, 18, 20]
y2 = [2, 4, 8, 16, 32, 64, 128, 256, 512, 1024]
y3 = [1, 3, 5, 7, 9, 11, 13, 15, 17, 19]
y4 = [2, 3, 5, 7, 11, 13, 17, 19, 23, 29]

fig = plt.figure()
axes= fig.subplots(2)

axes[0].plot(x, y1)
axes[0].plot(x, y2)
axes[1].plot(x, y3)
axes[1].plot(x, y4)

plt.suptitle("Title", fontsize=20)

plt.show()

実行結果
ちなみに前、matplotlibの解説した際はフォントサイズの変更に「{“fontsize”: X}」を追加しました。
この形でも認識されるのか試してみましょう。
from matplotlib import pyplot as plt

x = [1, 2, 3, 4, 5, 6, 7, 8, 9, 10]
y1 = [2, 4, 6, 8, 10, 12, 14, 16, 18, 20]
y2 = [2, 4, 8, 16, 32, 64, 128, 256, 512, 1024]
y3 = [1, 3, 5, 7, 9, 11, 13, 15, 17, 19]
y4 = [2, 3, 5, 7, 11, 13, 17, 19, 23, 29]

fig = plt.figure()
axes= fig.subplots(2)

axes[0].plot(x, y1)
axes[0].plot(x, y2)
axes[1].plot(x, y3)
axes[1].plot(x, y4)

plt.suptitle("Title", {"fontsize": 20})

plt.show()

実行結果
---------------------------------------------------------------------------
TypeError                                 Traceback (most recent call last)
<ipython-input-4-6d82abcbda3e> in <module>
     15 axes[1].plot(x, y4)
     16
---> 17 plt.suptitle("Title", {"fontsize": 20})
     18
     19 plt.show()

TypeError: suptitle() takes 1 positional argument but 2 were given
ダメでした。
最近は自分でもfontsize=Xという書き方をしているので、{“fontsize”:X}という書き方はあまり一般的ではないのかもしれません。
また時間ができたら調査してみたいと思います。
subplots:それぞれのグラフにタイトルを表示
それぞれのグラフにタイトルを表示するには、「set_title(“タイトル”)」というコマンドを用います。
from matplotlib import pyplot as plt

x = [1, 2, 3, 4, 5, 6, 7, 8, 9, 10]
y1 = [2, 4, 6, 8, 10, 12, 14, 16, 18, 20]
y2 = [2, 4, 8, 16, 32, 64, 128, 256, 512, 1024]
y3 = [1, 3, 5, 7, 9, 11, 13, 15, 17, 19]
y4 = [2, 3, 5, 7, 11, 13, 17, 19, 23, 29]

fig = plt.figure()
axes= fig.subplots(2)

axes[0].plot(x, y1)
axes[0].plot(x, y2)
axes[1].plot(x, y3)
axes[1].plot(x, y4)

plt.suptitle("Title", fontsize=20)
axes[0].set_title("Title1")
axes[1].set_title("Title2")

plt.show()

実行結果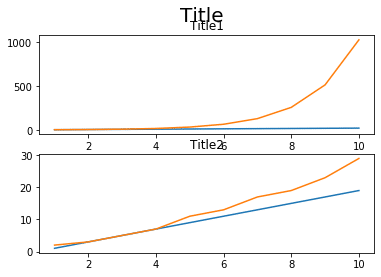
表示されましたが、他の箇所とかぶってしまっていて、みづらい状況になってしまっています。
この場合、「subplots_adjust」というコマンドを使って調整します。
subplotsを使う際にはこのコマンドはよく使うと思うので、また機会を作って細かく解説していきます。
ということで今回は紹介だけ。
from matplotlib import pyplot as plt

x = [1, 2, 3, 4, 5, 6, 7, 8, 9, 10]
y1 = [2, 4, 6, 8, 10, 12, 14, 16, 18, 20]
y2 = [2, 4, 8, 16, 32, 64, 128, 256, 512, 1024]
y3 = [1, 3, 5, 7, 9, 11, 13, 15, 17, 19]
y4 = [2, 3, 5, 7, 11, 13, 17, 19, 23, 29]

fig = plt.figure()
axes= fig.subplots(2)

axes[0].plot(x, y1)
axes[0].plot(x, y2)
axes[1].plot(x, y3)
axes[1].plot(x, y4)

plt.suptitle("Title", fontsize=20)
axes[0].set_title("Title1")
axes[1].set_title("Title2")

plt.subplots_adjust(top=0.85, hspace=0.5)

plt.show()

実行結果
かぶらない様に表示できました。
それぞれのグラフのタイトルのフォントサイズを変えるには「fontsize=X」で変更することができます。
from matplotlib import pyplot as plt

x = [1, 2, 3, 4, 5, 6, 7, 8, 9, 10]
y1 = [2, 4, 6, 8, 10, 12, 14, 16, 18, 20]
y2 = [2, 4, 8, 16, 32, 64, 128, 256, 512, 1024]
y3 = [1, 3, 5, 7, 9, 11, 13, 15, 17, 19]
y4 = [2, 3, 5, 7, 11, 13, 17, 19, 23, 29]

fig = plt.figure()
axes= fig.subplots(2)

axes[0].plot(x, y1)
axes[0].plot(x, y2)
axes[1].plot(x, y3)
axes[1].plot(x, y4)

plt.suptitle("Title", fontsize=20)
axes[0].set_title("Title1", fontsize=20)
axes[1].set_title("Title2", fontsize=20)

plt.subplots_adjust(top=0.85, hspace=0.5)

plt.show()

実行結果
subplot:グラフ一括表示の際のタイトルの表示
次にsubplotを使った際のタイトルの表示方法を見ていきましょう。
基本となるプログラムはこちらです。
from matplotlib import pyplot as plt

x = [1, 2, 3, 4, 5, 6, 7, 8, 9, 10]
y1 = [2, 4, 6, 8, 10, 12, 14, 16, 18, 20]
y2 = [2, 4, 8, 16, 32, 64, 128, 256, 512, 1024]
y3 = [1, 3, 5, 7, 9, 11, 13, 15, 17, 19]
y4 = [2, 3, 5, 7, 11, 13, 17, 19, 23, 29]

fig = plt.figure()

plt.subplot(2,1,1)
plt.plot(x, y1)
plt.plot(x, y2)

plt.subplot(2,1,2)
plt.plot(x, y3)
plt.plot(x, y4)

plt.show()

実行結果
ということでこのプログラムをもとにタイトルを追加していきます。
また先ほど解説した通り、タイトルとしてはグラフ全体のタイトルとそれぞれのグラフのタイトルと2種類あります。
まずはグラフ全体のタイトルを表示させてみましょう。
subplot:グラフ全体のタイトルの表示
subplotsを使った際、グラフ全体のタイトルを表示する際には「suptitle(“タイトル”)」を用いました。
subplotでもこのコマンドが使えるのでしょうか?
とりあえず試してみましょう。
from matplotlib import pyplot as plt

x = [1, 2, 3, 4, 5, 6, 7, 8, 9, 10]
y1 = [2, 4, 6, 8, 10, 12, 14, 16, 18, 20]
y2 = [2, 4, 8, 16, 32, 64, 128, 256, 512, 1024]
y3 = [1, 3, 5, 7, 9, 11, 13, 15, 17, 19]
y4 = [2, 3, 5, 7, 11, 13, 17, 19, 23, 29]

fig = plt.figure()

plt.subplot(2,1,1)
plt.plot(x, y1)
plt.plot(x, y2)

plt.subplot(2,1,2)
plt.plot(x, y3)
plt.plot(x, y4)

plt.suptitle("Title", fontsize=20)

plt.show()

実行結果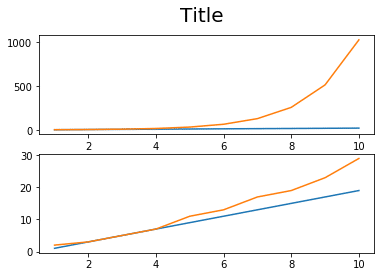
普通に表示することができました。
グラフ全体のタイトルを表示するには、subplotsを使っても、subplotを使っても「suptitle(“タイトル”)」でいいということが分かりました。
subplot:それぞれのグラフのタイトルを表示
ではそれぞれのグラフのタイトルを表示してみましょう。
subplotを使った際のタイトルの表示の仕方は、実はX軸、Y軸の表示範囲を指定したのと同じ考えでできます。
つまり通常のタイトルを表示するコマンド「title(“タイトル”)」を使うのですが、そのコマンドを追加する場所が重要。
タイトルを追加したいグラフの直下に書く必要があります。
つまりこんな感じ。
from matplotlib import pyplot as plt

x = [1, 2, 3, 4, 5, 6, 7, 8, 9, 10]
y1 = [2, 4, 6, 8, 10, 12, 14, 16, 18, 20]
y2 = [2, 4, 8, 16, 32, 64, 128, 256, 512, 1024]
y3 = [1, 3, 5, 7, 9, 11, 13, 15, 17, 19]
y4 = [2, 3, 5, 7, 11, 13, 17, 19, 23, 29]

fig = plt.figure()

plt.subplot(2,1,1)
plt.plot(x, y1)
plt.plot(x, y2)
plt.title("title1")

plt.subplot(2,1,2)
plt.plot(x, y3)
plt.plot(x, y4)
plt.title("title2")

plt.suptitle("Title", fontsize=20)

plt.show()

実行結果
表示できましたが、やっぱり他の箇所とかぶってしまっています。
前回、subplotsでのタイトル表示を解説した際、「subplots_adjust」で調整できるということを紹介しました。
subplotでも「subplots_adjust」で調整できるか試してみましょう。
from matplotlib import pyplot as plt

x = [1, 2, 3, 4, 5, 6, 7, 8, 9, 10]
y1 = [2, 4, 6, 8, 10, 12, 14, 16, 18, 20]
y2 = [2, 4, 8, 16, 32, 64, 128, 256, 512, 1024]
y3 = [1, 3, 5, 7, 9, 11, 13, 15, 17, 19]
y4 = [2, 3, 5, 7, 11, 13, 17, 19, 23, 29]

fig = plt.figure()

plt.subplot(2,1,1)
plt.plot(x, y1)
plt.plot(x, y2)
plt.title("title1")

plt.subplot(2,1,2)
plt.plot(x, y3)
plt.plot(x, y4)
plt.title("title2")

plt.suptitle("Title", fontsize=20)

plt.subplots_adjust(top=0.85, hspace=0.5)

plt.show()

実行結果
かぶらない様に調整できました。
ではそれぞれのグラフのタイトルのフォントサイズを変更してみましょう。
fontsize=Xをそれぞれのタイトルのコマンドに追加することで変更できます。
from matplotlib import pyplot as plt

x = [1, 2, 3, 4, 5, 6, 7, 8, 9, 10]
y1 = [2, 4, 6, 8, 10, 12, 14, 16, 18, 20]
y2 = [2, 4, 8, 16, 32, 64, 128, 256, 512, 1024]
y3 = [1, 3, 5, 7, 9, 11, 13, 15, 17, 19]
y4 = [2, 3, 5, 7, 11, 13, 17, 19, 23, 29]

fig = plt.figure()

plt.subplot(2,1,1)
plt.plot(x, y1)
plt.plot(x, y2)
plt.title("title1", fontsize=20)

plt.subplot(2,1,2)
plt.plot(x, y3)
plt.plot(x, y4)
plt.title("title2", fontsize=20)

plt.suptitle("Title", fontsize=20)

plt.subplots_adjust(top=0.85, hspace=0.5)

plt.show()

実行結果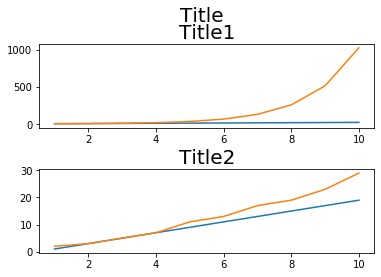
フォントサイズを変更できました。
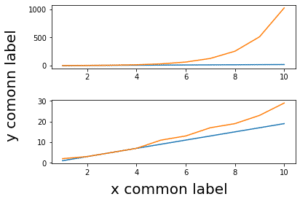
タイトルが入るとグッとグラフらしくなりますが、気になるのが軸名がまだ記載されていないこと。
ということで次回はsubplots、subplotでの軸名の表示方法を解説したいと思います。
ではでは今回はこんな感じで。
コメント