機械学習ライブラリScikit-learn
前回まで機械学習ライブラリScikit-learnの手書き数字のデータセットを使って、色々な機械学習モデルを試してきました。
Scikit-learnにはあと3つデータセットがあるのですが、これまで結構色々な事をやってきたので、そろそろもっと実践的なデータセットに移りたい。。。そんな思いが芽生えてきました。
ということで残り3つのデータセットに関しては、紹介だけということにしたいと思います。
そしてまた後ほど必要があれば、随時詳細を解説していくことにしましょう。
今回は3つのデータセットのうち「ワインの分類」のデータセットを紹介していきます。
このデータセットはワイン中に含まれる成分から、どんな種類のワインかを分類するというデータセットになります。
ではでは進めていきましょう。
データセットの読み込み
まずはデータセットを読み込んでいきます。
手間を省くため、オプションを「as_Frame = True」としてPandasのデータセット形式で読み込みましょう。
<セル1>

from sklearn.datasets import load_wine

wine = load_wine(as_frame=True)

print(wine.keys())

実行結果
dict_keys(['data', 'target', 'frame', 'target_names', 'DESCR', 'feature_names'])
次にデータフレームを表示してみます。
<セル2>

wine.frame

実行結果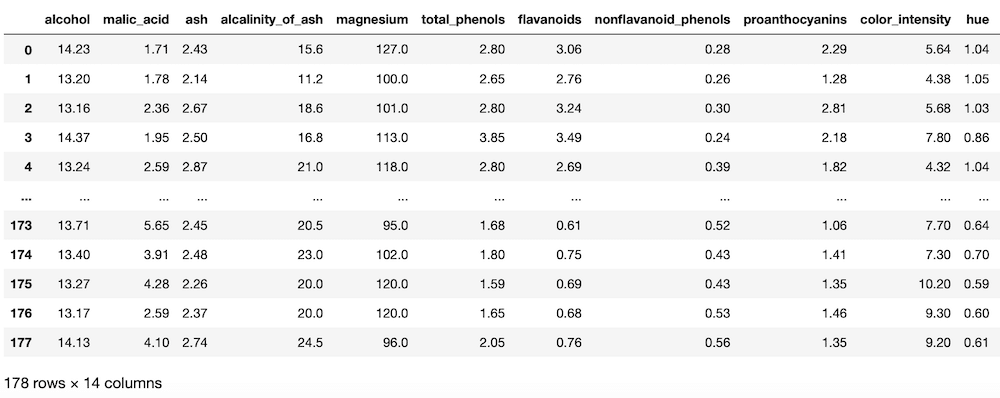
これで読み込みが完了しました。
データセットの概要を確認
次にデータセットの概要を確認してみましょう。
<セル3>

print(wine.DESCR)

実行結果
.. _wine_dataset:

Wine recognition dataset
------------------------

**Data Set Characteristics:**

    :Number of Instances: 178 (50 in each of three classes)
    :Number of Attributes: 13 numeric, predictive attributes and the class
    :Attribute Information:
 		- Alcohol
 		- Malic acid
 		- Ash
		- Alcalinity of ash
 		- Magnesium
		- Total phenols
 		- Flavanoids
 		- Nonflavanoid phenols
 		- Proanthocyanins
		- Color intensity
 		- Hue
 		- OD280/OD315 of diluted wines
 		- Proline

    - class:
            - class_0
            - class_1
            - class_2

    :Summary Statistics:

    ============================= ==== ===== ======= =====
                                   Min   Max   Mean     SD
    ============================= ==== ===== ======= =====
    Alcohol:                      11.0  14.8    13.0   0.8
    Malic Acid:                   0.74  5.80    2.34  1.12
    Ash:                          1.36  3.23    2.36  0.27
    Alcalinity of Ash:            10.6  30.0    19.5   3.3
    Magnesium:                    70.0 162.0    99.7  14.3
    Total Phenols:                0.98  3.88    2.29  0.63
    Flavanoids:                   0.34  5.08    2.03  1.00
    Nonflavanoid Phenols:         0.13  0.66    0.36  0.12
    Proanthocyanins:              0.41  3.58    1.59  0.57
    Colour Intensity:              1.3  13.0     5.1   2.3
    Hue:                          0.48  1.71    0.96  0.23
    OD280/OD315 of diluted wines: 1.27  4.00    2.61  0.71
    Proline:                       278  1680     746   315
    ============================= ==== ===== ======= =====

    :Missing Attribute Values: None
    :Class Distribution: class_0 (59), class_1 (71), class_2 (48)
    :Creator: R.A. Fisher
    :Donor: Michael Marshall (MARSHALL%PLU@io.arc.nasa.gov)
    :Date: July, 1988

(以下略)
Alcohol:アルコール濃度
Malic acid:リンゴ酸濃度
Ash:灰分濃度
Alcalinity of ash:灰のアルカリ性
Magnesium:マグネシウム量
Total phenol:フェノール量
Flavanoids:フラバノイド量
Nonflavanoid phenols:非フラバノイドフェノール類の量
Proanthocyanins:プロアントシアニン
Color intensity:色の強度
Hue:色調
OD280/OD315 of diluted wines:薄めたワインの280nmと315nmの波長の光に対する濁度
Proline:プロリン量
これらの値から「Class1」、「Class2」、「Class3」のカテゴリに分類します。
しかしワインには色々な成分がふくまれているのですね。
こういった普段考えていないような情報に当たれるのも、機械学習を学ぶいい点だと思います。
LinearSVCで機械学習してみる
このデータセットは「分類」をするデータセットなので、手書き数字のデータセットの時に使った「LinearSVC」 モデルを使って機械学習してみましょう。
<セル4>

from sklearn.svm import LinearSVC
from sklearn.model_selection import train_test_split
from sklearn.metrics import accuracy_score

x = wine.frame.iloc[:, 0:-1]
y = wine.frame.iloc[:, -1]

x_train, x_test, y_train, y_test = train_test_split(x, y, test_size=0.2, train_size=0.8)

model = LinearSVC()
model.fit(x_train, y_train)
pred = model.predict(x_test)

print(accuracy_score(y_test, pred))

実行結果
0.9166666666666666
/opt/anaconda3/lib/python3.7/site-packages/sklearn/svm/_base.py:977: ConvergenceWarning: Liblinear failed to converge, increase the number of iterations.
  "the number of iterations.", ConvergenceWarning)
警告が出てしまいました。
「increase the number of iterations」、つまり「繰り返し回数を増やしてくれ」ということなので、「max_iter」のオプションをつけて試してみましょう。
<セル4 修正>

from sklearn.svm import LinearSVC
from sklearn.model_selection import train_test_split
from sklearn.metrics import accuracy_score

x = wine.frame.iloc[:, 0:-1]
y = wine.frame.iloc[:, -1]

x_train, x_test, y_train, y_test = train_test_split(x, y, test_size=0.2, train_size=0.8)

model = LinearSVC(max_iter = 100000000)
model.fit(x_train, y_train)
pred = model.predict(x_test)

print(accuracy_score(y_test, pred))

実行結果
0.9722222222222222
「max_iter」を100000000にしたら警告が出なくなりました。
結果も「0.97222」とかなり高くてこのままでも十分そうです。
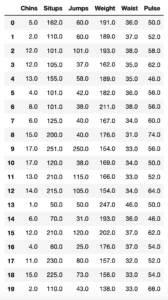
では次回は残り2つのうち、生理学的データと運動能力の関係のデータセットを紹介します。
ということで今回はこんな感じで。
コメント