plotly
前回、HTML上でインタラクティブなグラフ描写ができるライブラリplotlyで軸の値を文字列や日付に変更する方法を解説しました。
今回は軸は値の範囲を指定する方法と対数表示(log)にする方法を試していきましょう。
まずは基本となるプログラムから。
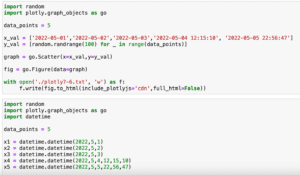
import random
import plotly.graph_objects as go

data_points = 100

x_val = [i for i in range(data_points)]
y_val = [random.randrange(100) for _ in range(data_points)]

graph = go.Scatter(x=x_val,y=y_val)

fig = go.Figure(data=graph)

with open('./plotly8-1.txt', 'w') as f:
     f.write(fig.to_html(include_plotlyjs='cdn',full_html=False))

実行結果
X軸の範囲を指定する方法
まずはX軸の範囲を指定してみましょう。
前々回の軸の目盛りの設定と同じく「fig.update_layout()」を使う方法と「fig.update_xaxes()」を使う方法があります。
fig.update_layout()を使う場合
fig.update_layout()を使う場合、そのオプションに「xais=dict(range(最小値, 最大値))」を追加します。
import random
import plotly.graph_objects as go

data_points = 100

x_val = [i for i in range(data_points)]
y_val = [random.randrange(100) for _ in range(data_points)]

graph = go.Scatter(x=x_val,y=y_val)

fig = go.Figure(data=graph)

fig.update_layout(xaxis=dict(range=(25, 50)))

with open('./plotly8-2.txt', 'w') as f:
     f.write(fig.to_html(include_plotlyjs='cdn',full_html=False))

実行結果
fig.update_xaxes()を使う場合
fig.update_xaxes()を使う場合、そのオプションに「range=(最小値, 最大値)」を追加します。
import random
import plotly.graph_objects as go

data_points = 100

x_val = [i for i in range(data_points)]
y_val = [random.randrange(100) for _ in range(data_points)]

graph = go.Scatter(x=x_val,y=y_val)

fig = go.Figure(data=graph)

fig.update_xaxes(range=(25, 50))

with open('./plotly8-3.txt', 'w') as f:
     f.write(fig.to_html(include_plotlyjs='cdn',full_html=False))

実行結果
Y軸の範囲を指定する方法
Y軸の範囲を指定する方法は、X軸の範囲を設定する方法と同じく「fig.update_layout()」を使う方法と「fig.update_yaxes()」を使う方法があります。
fig.update_layout()を使う場合
fig.update_layout()を使う場合、そのオプションに「yais=dict(range(最小値, 最大値))」を追加します。
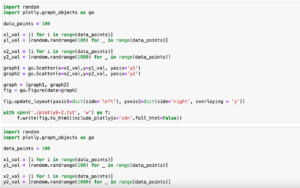
import random
import plotly.graph_objects as go

data_points = 100

x_val = [i for i in range(data_points)]
y_val = [random.randrange(100) for _ in range(data_points)]

graph = go.Scatter(x=x_val,y=y_val)

fig = go.Figure(data=graph)

fig.update_layout(yaxis=dict(range=(50, 100)))

with open('./plotly8-4.txt', 'w') as f:
     f.write(fig.to_html(include_plotlyjs='cdn',full_html=False))

実行結果
fig.update_yaxes()を使う場合
fig.update_yaxes()を使う場合、そのオプションに「range=(最小値, 最大値)」を追加します。
import random
import plotly.graph_objects as go

data_points = 100

x_val = [i for i in range(data_points)]
y_val = [random.randrange(100) for _ in range(data_points)]

graph = go.Scatter(x=x_val,y=y_val)

fig = go.Figure(data=graph)

fig.update_yaxes(range=(50, 100))

with open('./plotly8-5.txt', 'w') as f:
     f.write(fig.to_html(include_plotlyjs='cdn',full_html=False))

実行結果
軸の値を対数表示(log)にする方法
今回はもう一つ、軸の値を対数表示にしてみましょう。
こちらも「fig.update_layout()」を使う方法と「fig.update_xaxes()」、もしくは「fig.update_yaxes()」を使う方法があります。
今回はX軸だけで試してみますが、同様にしてY軸を対数表示にすることも可能です。
fig.update_layout()を使う場合
fig.update_layout()を使う場合、X軸を対数にする場合は「xais=dict(type=’log’)」、Y軸を対数にする場合は「yais=dict(type=’log’)」を追加します。
import random
import plotly.graph_objects as go

data_points = 100

x_val = [i for i in range(data_points)]
y_val = [random.randrange(100) for _ in range(data_points)]

graph = go.Scatter(x=x_val,y=y_val)

fig = go.Figure(data=graph)

fig.update_layout(xaxis=dict(type='log'))

with open('./plotly8-6.txt', 'w') as f:
     f.write(fig.to_html(include_plotlyjs='cdn',full_html=False))

実行結果
fig.update_xaxes()、もしくはfig.update_yaxes()を使う場合
fig.update_xaxes()、もしくはfig.update_yaxes()を使う場合はそのオプションに「type=’log’」を追加します。
import random
import plotly.graph_objects as go

data_points = 100

x_val = [i for i in range(data_points)]
y_val = [random.randrange(100) for _ in range(data_points)]

graph = go.Scatter(x=x_val,y=y_val)

fig = go.Figure(data=graph)

fig.update_xaxes(type='log')

with open('./plotly8-7.txt', 'w') as f:
     f.write(fig.to_html(include_plotlyjs='cdn',full_html=False))

実行結果
これでX軸、Y軸の範囲を指定して表示したり、対数表示ができるようになりました。
次回は左右にY軸がある2軸グラフや上下にX軸がある2軸グラフの表示の仕方を勉強してみましょう。
ではでは今回はこんな感じで。
コメント