フォントサイズの指定の仕方
subplotsを使って複数のグラフを表示の仕方を解説した時、タイトルのフォントサイズを変えるのに「fontsize = X」という記述の仕方をしました。
しかし前にグラフのタイトルの表示方法を解説した時には「{“fontsize”: X}」という記述の仕方をしました。

私自身、最初の頃には「{“fontsize”: X}」が正しいと思っていたのですが、最近では「fontsize = X」という記述の仕方をしていて、ちょっと混乱しています。
ということで今回はグラフ表示をする時の色々な文字のサイズを変えるのに「fontsize = X」、「{“fontsize”: X}」のどちらも全く同じように使えるのか、それとも使えたり、使えなかったりするのか試してみたいと思います。
試すのは、タイトルを表示するtitle、suptitle、軸名を表示するxlabel、ylabel、set_xlabel、set_ylabel、軸の数値の表示を変えるtick_paramsを試してみます。
また凡例(legend)のフォントサイズは「prop={“size”: 20}」と記述していたのでついでにこれも「fontsize=X」や「{“fontsize”: X}」と記述できるか試してみましょう。
titleのフォントサイズ
まずはtitleのフォントサイズの記述を試してみます。
基本となるプログラムはこちらです。
from matplotlib import pyplot as plt

y_value = [1, 2, 4, 8, 16, 32, 64, 128, 256, 1028]
x_value = range(1, len(y_value)+1)

plt.plot(x_value, y_value)

plt.title("title")

plt.show()

実行結果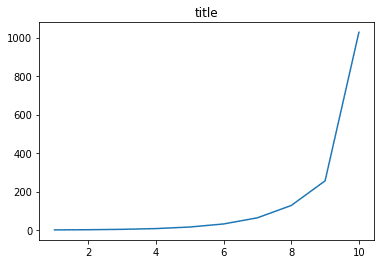
「{“fontsize”: X}」でフォントサイズを指定してみます。
from matplotlib import pyplot as plt

y_value = [1, 2, 4, 8, 16, 32, 64, 128, 256, 1028]
x_value = range(1, len(y_value)+1)

plt.plot(x_value, y_value)

plt.title("title", {"fontsize": 20})

plt.show()

実行結果
「title」のフォントサイズが大きくなりました。
次に「fontsize=X」で指定してみます。
from matplotlib import pyplot as plt

y_value = [1, 2, 4, 8, 16, 32, 64, 128, 256, 1028]
x_value = range(1, len(y_value)+1)

plt.plot(x_value, y_value)

plt.title("title", fontsize=20)

plt.show()

実行結果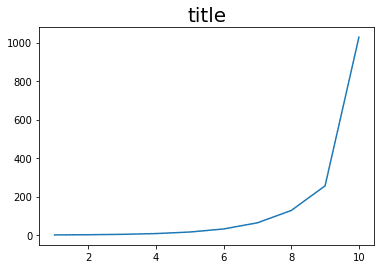
こちらも「title」のサイズが大きくなりました。
つまりtitleに対しては「{“fontsize”: X}」でも「fontsize=X」でもどちらでも大丈夫です。
suptitleのフォントサイズ
次に複数のグラフを一括表示した際に用いた「suptitle」でも試してみましょう。
ちなみにこの「suptitle」は複数のグラフを一括表示した場合だけでなく、一つのグラフだけの時でも使用することができます。
ということで先ほどのプログラムを用いて試してみます。
まずは「{“fontsize”: X}」から。
from matplotlib import pyplot as plt

y_value = [1, 2, 4, 8, 16, 32, 64, 128, 256, 1028]
x_value = range(1, len(y_value)+1)

plt.plot(x_value, y_value)

plt.suptitle("suptitle", {"fontsize": 20})

plt.show()

実行結果
---------------------------------------------------------------------------
TypeError                                 Traceback (most recent call last)
<ipython-input-19-ae8cb474caff> in <module>
      6 plt.plot(x_value, y_value)
      7
----> 8 plt.suptitle("suptitle", {"fontsize": 20})
      9
     10 plt.show()

TypeError: suptitle() takes 1 positional argument but 2 were given
前に試した時のようにエラーがでました。
次に「fontsize=X」。
from matplotlib import pyplot as plt

y_value = [1, 2, 4, 8, 16, 32, 64, 128, 256, 1028]
x_value = range(1, len(y_value)+1)

plt.plot(x_value, y_value)

plt.suptitle("suptitle", fontsize=20)

plt.show()

実行結果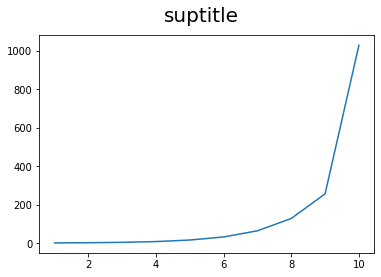
suptitleでは「{“fontsize”: X}」は使えず、「fontsize=X」のみが使えました。
xlabel、ylabelのフォントサイズ
今回はxlabel、ylabelとフォントサイズを指定するものが二つあるので、「fontsize=X」と「{“fontsize”:X}」の両方を一度に試してみます。
from matplotlib import pyplot as plt

y_value = [1, 2, 4, 8, 16, 32, 64, 128, 256, 1028]
x_value = range(1, len(y_value)+1)

plt.plot(x_value, y_value)

plt.xlabel("xlabel", {"fontsize":20})
plt.ylabel("ylabel", fontsize=20)

plt.show()

実行結果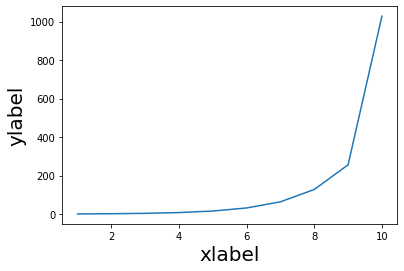
X軸名、Y軸名ともに大きくなりました。
ということはxlabel、ylabelに対しては「fontsize=X」でも「{“fontsize”:X}」でもどちらでもよいということになります。
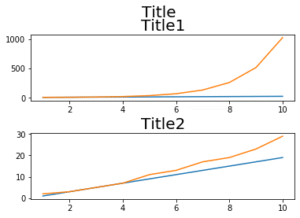
set_xlabel、set_ylabelのフォントサイズ
set_xlabel、set_ylabelも「fontsize=X」と「{“fontsize”:X}」の両方を一度に試してみます。
from matplotlib import pyplot as plt

x = [1, 2, 3, 4, 5, 6, 7, 8, 9, 10]
y1 = [2, 4, 6, 8, 10, 12, 14, 16, 18, 20]
y2 = [2, 4, 8, 16, 32, 64, 128, 256, 512, 1024]

fig = plt.figure()
axes= fig.subplots(2)

axes[0].plot(x, y1)
axes[1].plot(x, y2)

axes[1].set_xlabel("xlabel", {"fontsize":20})
axes[0].set_ylabel("ylabel", fontsize=20)

plt.show()

実行結果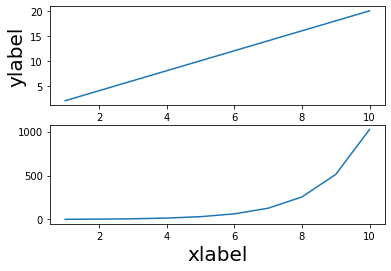
こちらも両方ともフォントサイズが変わり、どちらでも良いことが分かりました。
legendのフォントサイズ
まずはlegendから試していきます。
legendに関しては前は「prop={“size”: X}」と記述していました。
from matplotlib import pyplot as plt

y_value = [1, 2, 4, 8, 16, 32, 64, 128, 256, 1028]
x_value = range(1, len(y_value)+1)

plt.plot(x_value, y_value, label="graph")

plt.legend(prop={"size": 20})
plt.tick_params()

plt.show()

実行結果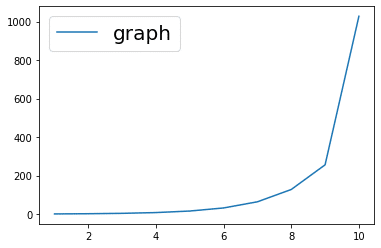
凡例のフォントサイズが大きくなりました。
次に「prop={“size”: X}」と似ているという理由から、「{“fontsize”:X}」を試してみましょう。
from matplotlib import pyplot as plt

y_value = [1, 2, 4, 8, 16, 32, 64, 128, 256, 1028]
x_value = range(1, len(y_value)+1)

plt.plot(x_value, y_value, label="graph")

plt.legend({"fontsize": 20})
plt.tick_params()

plt.show()

実行結果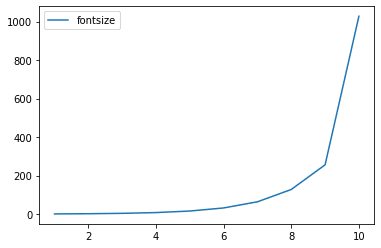
エラーにはならなかったものの、「graph」と表示していた凡例が「fontsize」に変わってしまいました。
またフォントサイズも変化していません。
意図した形ではないので、残念ながらこれはダメということで。
次は「fontsize=X」を試してみます。
from matplotlib import pyplot as plt

y_value = [1, 2, 4, 8, 16, 32, 64, 128, 256, 1028]
x_value = range(1, len(y_value)+1)

plt.plot(x_value, y_value, label="graph")

plt.legend(fontsize=20)
plt.tick_params()

plt.show()

実行結果
凡例の「graph」のフォントサイズが大きくなりました。
ということでlegendには「fontsize=X」、もしくは「prop={“size”: X}」でフォントサイズを変更でき、「{“fontsize”:X}」ではできないと言う結果になりました。
tick_paramsのフォントサイズ
最後に軸の数値のフォントを変えるtick_paramsに対して「{“fontsize”:X}」、「fontsize=X」を試してみましょう。
まずは「{“fontsize”:X}」から。
from matplotlib import pyplot as plt

y_value = [1, 2, 4, 8, 16, 32, 64, 128, 256, 1028]
x_value = range(1, len(y_value)+1)

plt.plot(x_value, y_value, label="graph")

plt.legend()
plt.tick_params({"fontsize":20})

plt.show()

実行結果
---------------------------------------------------------------------------
ValueError                                Traceback (most recent call last)
<ipython-input-44-e0b533869bab> in <module>
      7
      8 plt.legend()
----> 9 plt.tick_params({"fontsize":20})
     10
     11 plt.show()

/opt/anaconda3/lib/python3.7/site-packages/matplotlib/pyplot.py in tick_params(axis, **kwargs)
   2967 @docstring.copy(Axes.tick_params)
   2968 def tick_params(axis='both', **kwargs):
-> 2969     return gca().tick_params(axis=axis, **kwargs)
   2970
   2971

/opt/anaconda3/lib/python3.7/site-packages/matplotlib/axes/_base.py in tick_params(self, axis, **kwargs)
   3000
   3001         """
-> 3002         cbook._check_in_list(['x', 'y', 'both'], axis=axis)
   3003         if axis in ['x', 'both']:
   3004             xkw = dict(kwargs)

/opt/anaconda3/lib/python3.7/site-packages/matplotlib/cbook/__init__.py in _check_in_list(values, **kwargs)
   2162             raise ValueError(
   2163                 "{!r} is not a valid value for {}; supported values are {}"
-> 2164                 .format(v, k, ', '.join(map(repr, values))))

ValueError: {'fontsize': 20} is not a valid value for axis; supported values are 'x', 'y', 'both'
エラーがでました。
「{‘fontsize’: 20} is not a valid value for axis」とあるように有効な値ではありませんとのことらしいです。
では「fontsize=X」を試しみます。
from matplotlib import pyplot as plt

y_value = [1, 2, 4, 8, 16, 32, 64, 128, 256, 1028]
x_value = range(1, len(y_value)+1)

plt.plot(x_value, y_value, label="graph")

plt.legend()
plt.tick_params(fontsize=20)

plt.show()

実行結果
---------------------------------------------------------------------------
ValueError                                Traceback (most recent call last)
<ipython-input-49-84655b4cbc2a> in <module>
      7
      8 plt.legend()
----> 9 plt.tick_params(fontsize=20)
     10
     11 plt.show()

/opt/anaconda3/lib/python3.7/site-packages/matplotlib/pyplot.py in tick_params(axis, **kwargs)
   2967 @docstring.copy(Axes.tick_params)
   2968 def tick_params(axis='both', **kwargs):
-> 2969     return gca().tick_params(axis=axis, **kwargs)
   2970
   2971

/opt/anaconda3/lib/python3.7/site-packages/matplotlib/axes/_base.py in tick_params(self, axis, **kwargs)
   3007             xkw.pop('labelleft', None)
   3008             xkw.pop('labelright', None)
-> 3009             self.xaxis.set_tick_params(**xkw)
   3010         if axis in ['y', 'both']:
   3011             ykw = dict(kwargs)

/opt/anaconda3/lib/python3.7/site-packages/matplotlib/axis.py in set_tick_params(self, which, reset, **kw)
    872         if which == 'minor' or which == 'both':
    873             dicts.append(self._minor_tick_kw)
--> 874         kwtrans = self._translate_tick_kw(kw)
    875
    876         # this stashes the parameter changes so any new ticks will

/opt/anaconda3/lib/python3.7/site-packages/matplotlib/axis.py in _translate_tick_kw(kw)
    939                 raise ValueError(
    940                     "keyword %s is not recognized; valid keywords are %s"
--> 941                     % (key, kwkeys))
    942             kwtrans.update(kw)
    943         return kwtrans

ValueError: keyword fontsize is not recognized; valid keywords are ['size', 'width', 'color', 'tickdir', 'pad', 'labelsize', 'labelcolor', 'zorder', 'gridOn', 'tick1On', 'tick2On', 'label1On', 'label2On', 'length', 'direction', 'left', 'bottom', 'right', 'top', 'labelleft', 'labelbottom', 'labelright', 'labeltop', 'labelrotation', 'grid_agg_filter', 'grid_alpha', 'grid_animated', 'grid_antialiased', 'grid_clip_box', 'grid_clip_on', 'grid_clip_path', 'grid_color', 'grid_contains', 'grid_dash_capstyle', 'grid_dash_joinstyle', 'grid_dashes', 'grid_drawstyle', 'grid_figure', 'grid_fillstyle', 'grid_gid', 'grid_in_layout', 'grid_label', 'grid_linestyle', 'grid_linewidth', 'grid_marker', 'grid_markeredgecolor', 'grid_markeredgewidth', 'grid_markerfacecolor', 'grid_markerfacecoloralt', 'grid_markersize', 'grid_markevery', 'grid_path_effects', 'grid_picker', 'grid_pickradius', 'grid_rasterized', 'grid_sketch_params', 'grid_snap', 'grid_solid_capstyle', 'grid_solid_joinstyle', 'grid_transform', 'grid_url', 'grid_visible', 'grid_xdata', 'grid_ydata', 'grid_zorder', 'grid_aa', 'grid_c', 'grid_ds', 'grid_ls', 'grid_lw', 'grid_mec', 'grid_mew', 'grid_mfc', 'grid_mfcalt', 'grid_ms']
こちらもエラーになってしまいました。
エラーとしては「keyword fontsize is not recognized; valid keywords are […]」ということで「fontsize」というキーワードはない。
そしてカギカッコ内にある[‘size’, ‘width’…]などがキーワードだと言っています。
そう、実はtick_paramsに対しては「fontsize」ではなく、「labelsize」なんです。
from matplotlib import pyplot as plt

y_value = [1, 2, 4, 8, 16, 32, 64, 128, 256, 1028]
x_value = range(1, len(y_value)+1)

plt.plot(x_value, y_value, label="graph")

plt.legend()
plt.tick_params(labelsize=20)

plt.show()

実行結果
「labelsize」で、ちゃんとフォントサイズを変更することができました。
まとめ
ということでこれまでの結果をまとめてみましょう。
| fontsize=X | {“fontsize”:X} | その他 | |
| title | ○ | ○ | |
| suptitle | ○ | × | |
| xlabel ylabel | ○ | ○ | |
| set_xlabel set_ylabel | ○ | ○ | |
| legend | ○ | × | prop={“size”: X} |
| tick_params | × | × | labelsize=X |
tick_paramで「fontsize」が使えないのは、知識不足だったとして、他のもので言うと全てのコマンドで「fontsize=X」が使えました。
反面、{“fontsize”: X}はsuptitleやlegendでは使えないと言う結果になりました。
と言うことはとりあえずフォントサイズを変えたい場合は「fontsize=X」という記述の仕方をしてみて、ダメなら調べると言うのが良さそうです。
ではでは今回はこんな感じで。
コメント